


Practical Example: “Where Are We Making — and Losing — Profit?” (Superstore Dashboard)
Status: October 2, 2025
🧭 Introduction
Tableau Next marks a new era of analytics within the Salesforce ecosystem — a cloud-native, AI-enhanced platform that unites visualization, conversation, and automation.
As part of Refresher Week, we explored Tableau Next to evaluate its usability, new features, and current limitations.
To do this, I built a simple Superstore dashboard as a test case to experience how the new interface works and how the integrated AI Agent supports data exploration.
⚙️ What’s New in Tableau Next
Compared to Tableau Cloud or Desktop, Tableau Next introduces several innovative features:
- ☁️ Cloud-First Architecture: Everything runs directly in the browser.
- 🤖 Agentforce Integration: Ask questions about your data using natural language.
- 🧩 Semantic Layer: Centralized definitions for metrics and business logic.
- ⚡ Action Layer: Connect insights directly to workflows within Salesforce.
These changes aim to make analytics more interactive, intelligent, and accessible — a shift from static dashboards to proactive, AI-driven insights.
📊 Practical Example – The Superstore Dashboard
To explore Tableau Next in practice, I created a small dashboard titled:
“Where Are We Making — and Losing — Profit?”
It includes three analytical sections, each visualized separately.
Below are three consecutive screenshots illustrating each part of the dashboard.
1️⃣ Sales and Profit Ratio by Year
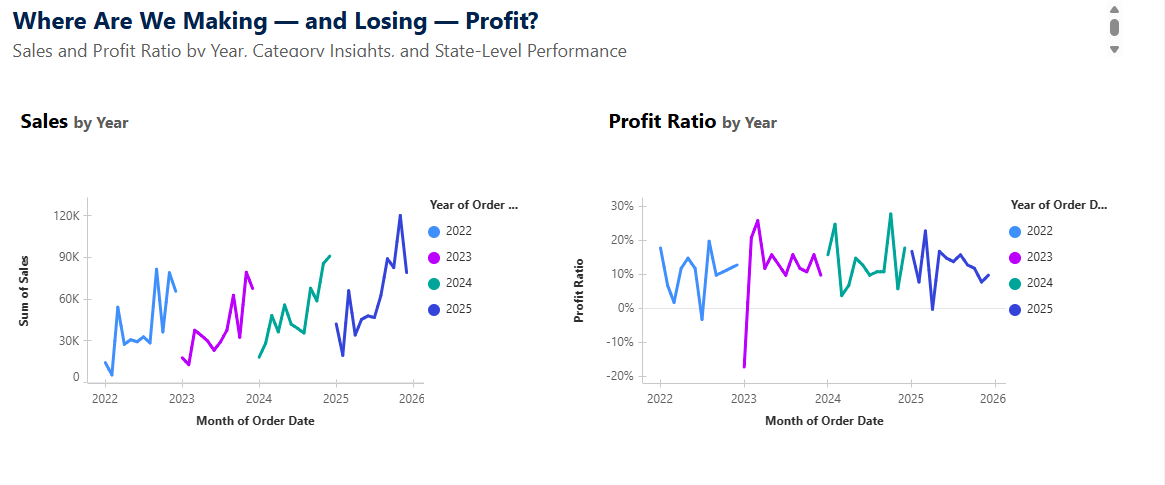
This first section focuses on trends over time (2022–2025).
Sales increased steadily, while profit ratio fluctuated — suggesting that higher sales didn’t always mean higher profits.
2️⃣ Categories and Sub-Categories by Profit
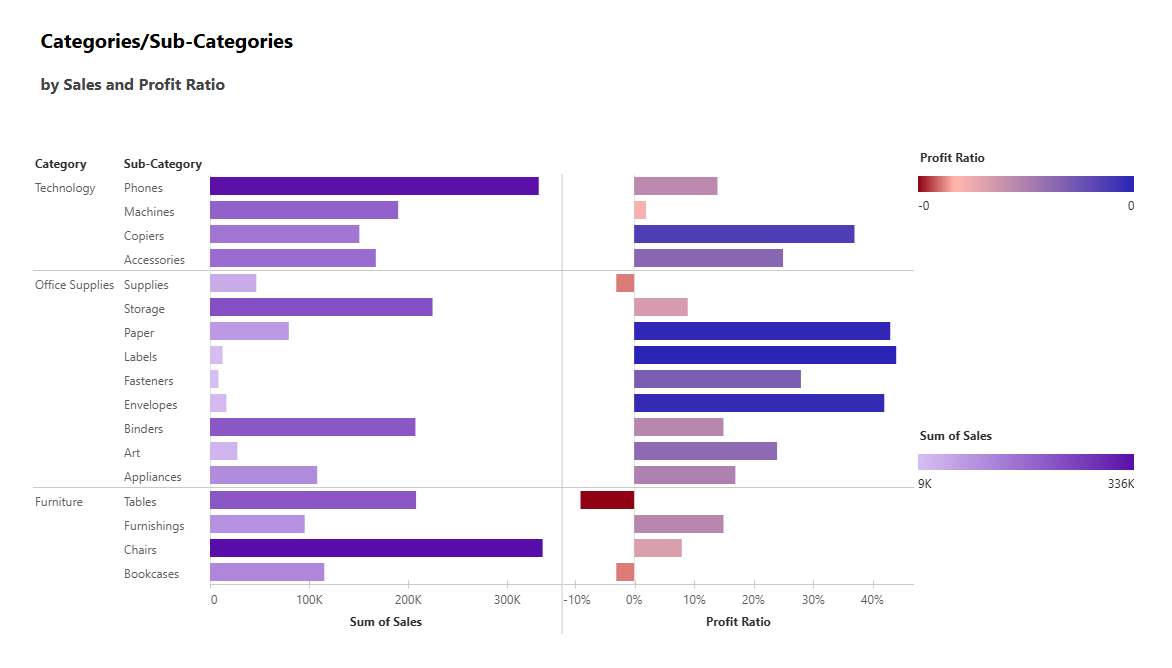
This view compares product performance. Copiers, Phones, and Accessories were the most profitable sub-categories, while Tables and Bookcases had high sales but negative profit.
A useful perspective for pricing or supply-chain strategy.
3️⃣ Top and Bottom States by Profitability
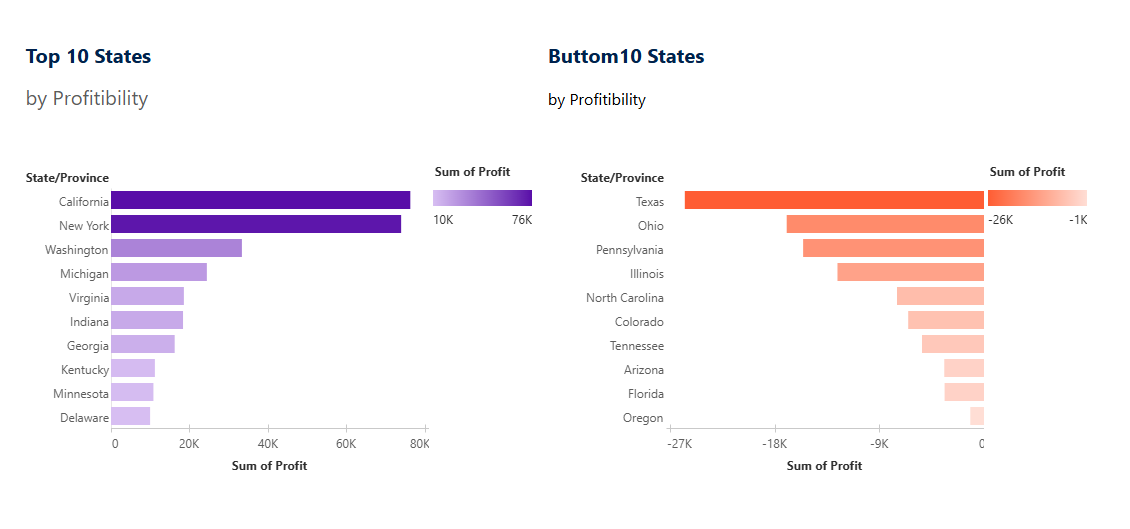
Here, regional performance becomes visible:
California and New York lead in profit, whereas Texas and Ohio consistently lose money.
This helps identify where business performance can be improved geographically.
🤖 Using the Tableau Next Agent
After building the dashboard, I explored the AI Agent — one of Tableau Next’s most promising new features.
It allows users to ask questions directly about their data, generating quick analytical summaries.
💬 Example 1 – Most Profitable Sub-Category
Question: “Which sub-category is most profitable, and which one loses the most money?”
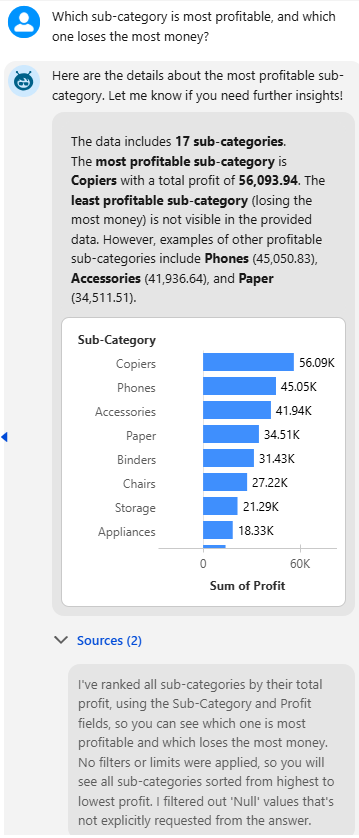
The Agent correctly identified Copiers as the most profitable sub-category (around $56K), followed by Phones and Accessories.
This confirmed the dashboard’s results and demonstrated how efficiently the Agent summarizes key metrics.
What makes this feature particularly interesting is that the Agent automatically generates visualizations — such as bar charts — directly inside the chat.
These mini visual insights help interpret the answer more intuitively without switching back to the dashboard view, making the analytical conversation feel dynamic and interactive.
💬 Example 2 – Profitability Trends by State
Question: “Which states improved profitability over the last two years?”
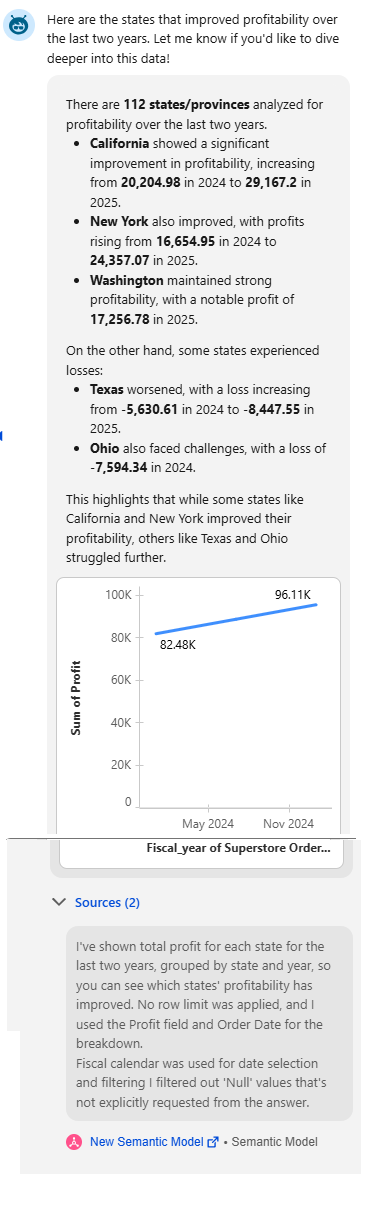
The Agent found that California and New York improved their profits,
while Texas and Ohio declined.
This added a time-based perspective that wasn’t directly visible in the dashboard, showing how the Agent can extend manual analysis with temporal comparisons.
An interesting aspect of Tableau Next’s Agent is the “Sources” section, which appears below every response.
It lists the semantic model and specific data fields used for the calculation.
This provides valuable transparency, showing exactly where each insight originates and helping users trust that the Agent’s conclusions are based on verifiable data rather than assumptions.
⚠️ Limitations
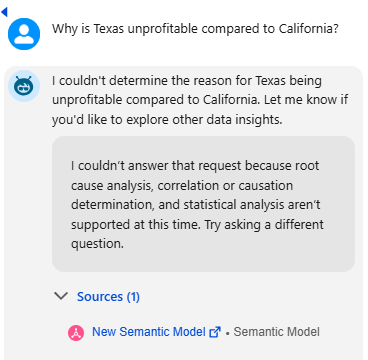
When asked “Why is Texas unprofitable compared to California?”,
the Agent explained that root-cause and correlation analysis are not yet supported in Tableau Next.
This does not mean that the data itself is incomplete — rather, the Agent is currently limited to descriptive analytics and cannot yet infer or explain causation.
In short, the Agent performs well for summary and comparison questions, but not yet for diagnostic or predictive insights.
⚙️ Technical Experience and Stability (as of October 2, 2025)
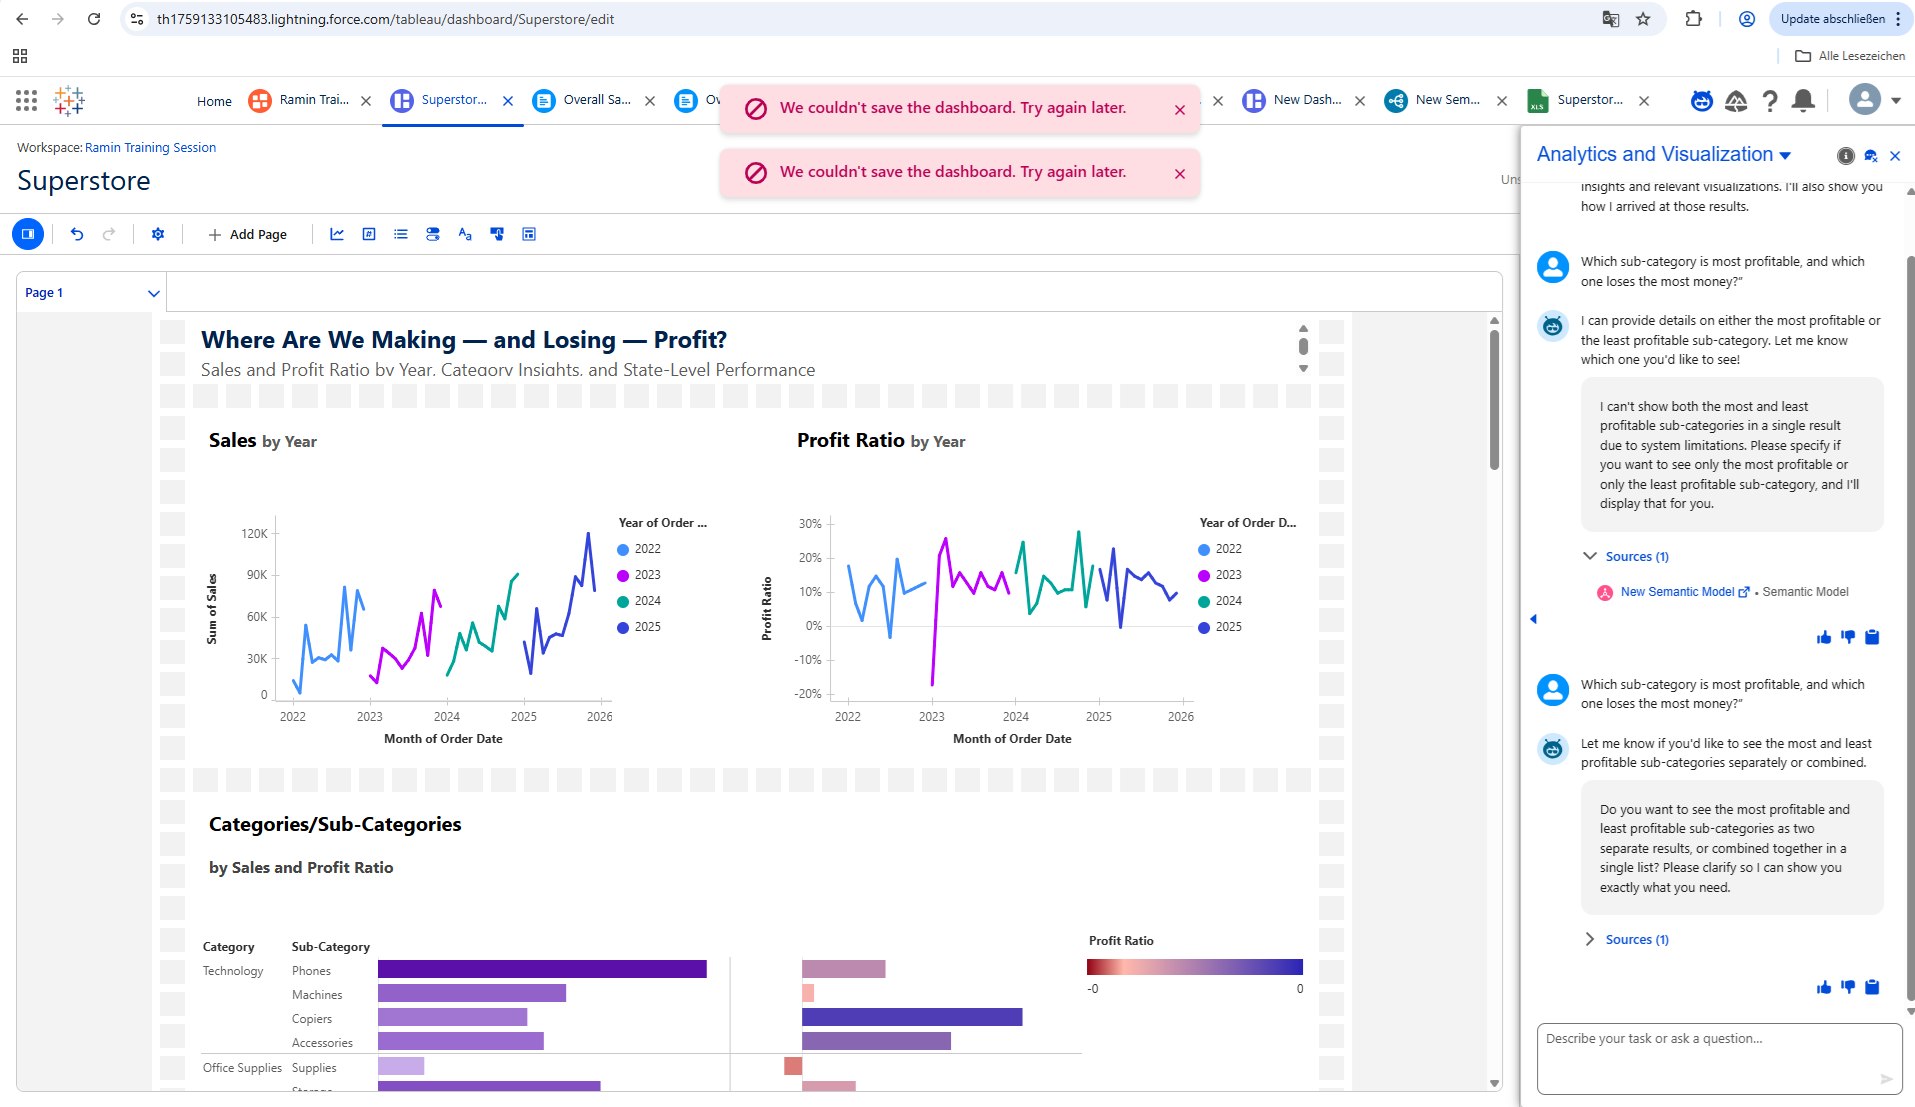
During testing, Tableau Next displayed a saving error:
“We couldn’t save the dashboard. Try again later.”
After refreshing, several unsaved steps were lost, and I couldn’t use the Agent until saving worked again.
This issue — still present as of October 2, 2025 — highlights that Tableau Next, while powerful, still has a few early-stage “childhood bugs.”
Despite this, the overall concept and workflow remain strong.
💡 Evaluation

🧾 Conclusion
Tableau Next combines visualization, automation, and AI in a unified platform.
Through the Superstore dashboard example, I experienced how analytics is evolving — from manual dashboards toward interactive, AI-assisted exploration.
Although Tableau Next still needs refinement in technical stability, it already demonstrates how users will work with data in the near future:
by asking, exploring, and collaborating — all in one place.
In summary, Tableau Next is not just an upgrade; it’s the start of a more intelligent and accessible era of business analytics.