


I recently challenged myself to create a Makeover Monday using a dataset called “The Periodic Table of AI,” which provides 14 categories of AI companies, including Foundation Models, Infrastructure, Healthcare, etc.
I wanted to create a visual with a periodic-table layout, grouped by AI Category; however, I was struggling with limitations inherent in existing methods, such as indexing and creating individual sheets for each box.
The limitations of using the INDEX() function stemmed from its sequential assignment of positions, which did not allow control over where each category landed. The limitation in creating separate sheets lay in the very inconsistent sizing and the manual effort required to create 14 separate worksheets.
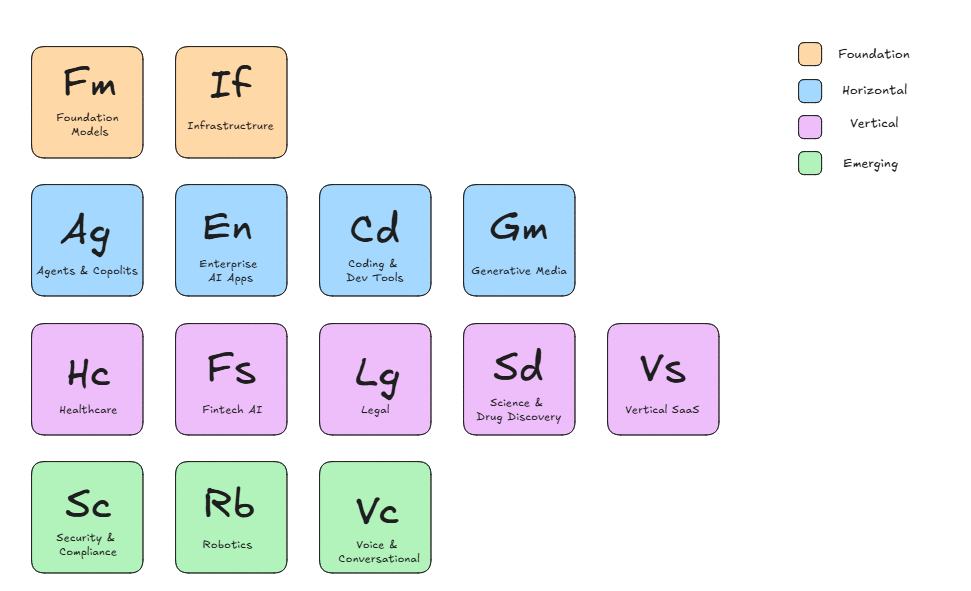
Before writing any calculations, I sketched out the intended layout:
In a previous Information Lab Blog by Robin Kennedy on Chart Matrices and how to create a grid, he dives into INDEX functions; however, he briefly mentions that for smaller datasets, one can manually use CASE/WHEN statements to assign coordinates. I wasn’t familiar with this approach and started researching how to implement it. I found it very easy to understand and adapt. I wanted to create a quick walkthrough and tutorial for anyone else who may be interested or facing the same challenges I did. CASE/WHEN statements:
CASE/WHEN statements are the backbone of this approach. CASE/WHEN statements are essentially a lookup table within a calculated field. You provide a guideline for it to follow, including the field to check, a list of values, and an output for each match. Tableau reads each row of your data, checks the rules, and returns the output.
The default syntax looks like this:
CASE [Field]
WHEN "value1" THEN result1
WHEN "value2" THEN result2
WHEN "value3" THEN result3
ELSE default_result
END
Definitions:
CASE [Field]:
For this field in my data
WHEN "value1" THEN result1:
When it is this value, return this result
ELSE default_result:
If there is no corresponding value, return a default predetermined result
END:
Closing Statement
To use this method to create coordinates, you would use 2 separate calculated fields: one for row coordinates and one for column coordinates. You set the CASE to your field, which in this dataset was [Name], check whether it is a value (the name of an AI sector), and assign it a coordinate (a number). As seen in my previous sketch, I wanted Foundation to be the top row, followed by Horizontal, Vertical, and Emerging.
Let's run through my example.
Tile Row Calculated field:
CASE [Name]
WHEN "Foundation Models & LLMs" THEN 1
WHEN "AI Infrastructure" THEN 1
WHEN "AI Agents & Copilots" THEN 2
WHEN "Enterprise AI Software" THEN 2
WHEN "AI Coding & Dev Tools" THEN 2
WHEN "Generative Media" THEN 2
WHEN "Healthcare AI" THEN 3
WHEN "Financial Services AI" THEN 3
WHEN "Legal AI" THEN 3
WHEN "Science & Drug Discovery" THEN 3
WHEN "Vertical SaaS + AI" THEN 3
WHEN "AI Security & Compliance" THEN 4
WHEN "Autonomous & Robotics" THEN 4
WHEN "AI Voice & Conversational" THEN 4
END
Breaking this down in plain words. For the Name field, when the name is "Foundation Models & LLMs” or “AI Infrastructure,” place it in coordinate 1. We are only placing these 2 on the first row as they are the only 2 in the Foundation category. When the name is "AI Agents & Copilots", "Enterprise AI Software", “AI Coding and Dev Tools”, or “Generative Media”, place them in coordinate 2 and so on. This is for the row tile coordinates; for each category, there will be a new row.
Similarly, to create the column coordinates, do the same thing; however, now you are placing coordinates for the columns.
Tile Column calculated field:
CASE [Name]
WHEN "Foundation Models & LLMs" THEN 1
WHEN "AI Infrastructure" THEN 2
WHEN "AI Agents & Copilots" THEN 1
WHEN "Enterprise AI Software" THEN 2
WHEN "AI Coding & Dev Tools" THEN 3
WHEN "Generative Media" THEN 4
WHEN "Healthcare AI" THEN 1
WHEN "Financial Services AI" THEN 2
WHEN "Legal AI" THEN 3
WHEN "Science & Drug Discovery" THEN 4
WHEN "Vertical SaaS + AI" THEN 5
WHEN "AI Security & Compliance" THEN 1
WHEN "Autonomous & Robotics" THEN 2
WHEN "AI Voice & Conversational" THEN 3
END
Breaking this down in plain words again. When the name is "Foundation Models & LLMs,” place it in coordinate 1. When the name is “AI Infrastructure”, place it into coordinate 2. This allows them to be on the same row (from the row calculated field), but sit next to each other. Moving on to the next line, similarly, place "AI Agents & Copilots" in coordinate 1, "Enterprise AI Software" in coordinate 2, “AI Coding and Dev Tools” in coordinate 3, and “Generative Media” in coordinate 4, and so on. This creates that “Periodic Table” look.
The resulting coordinate grid looks like this:
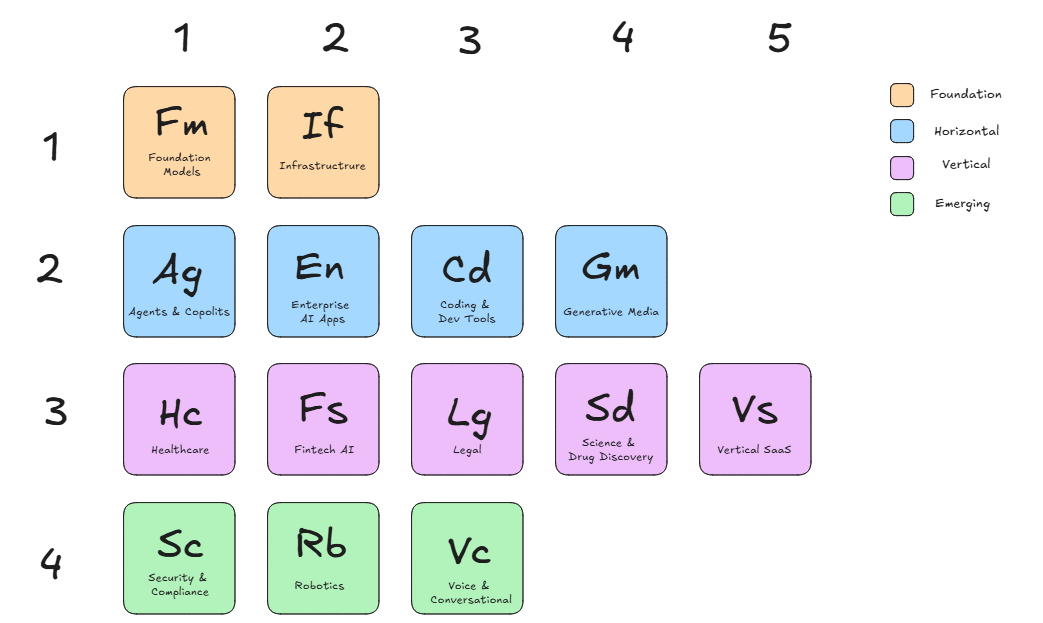
I placed Tile Column into columns, Tile Rows into Rows, Name and Symbol into Labels, and AI category into color. I further formatted tooltips so that one can get a high-level understanding of each type of AI.
The Result:
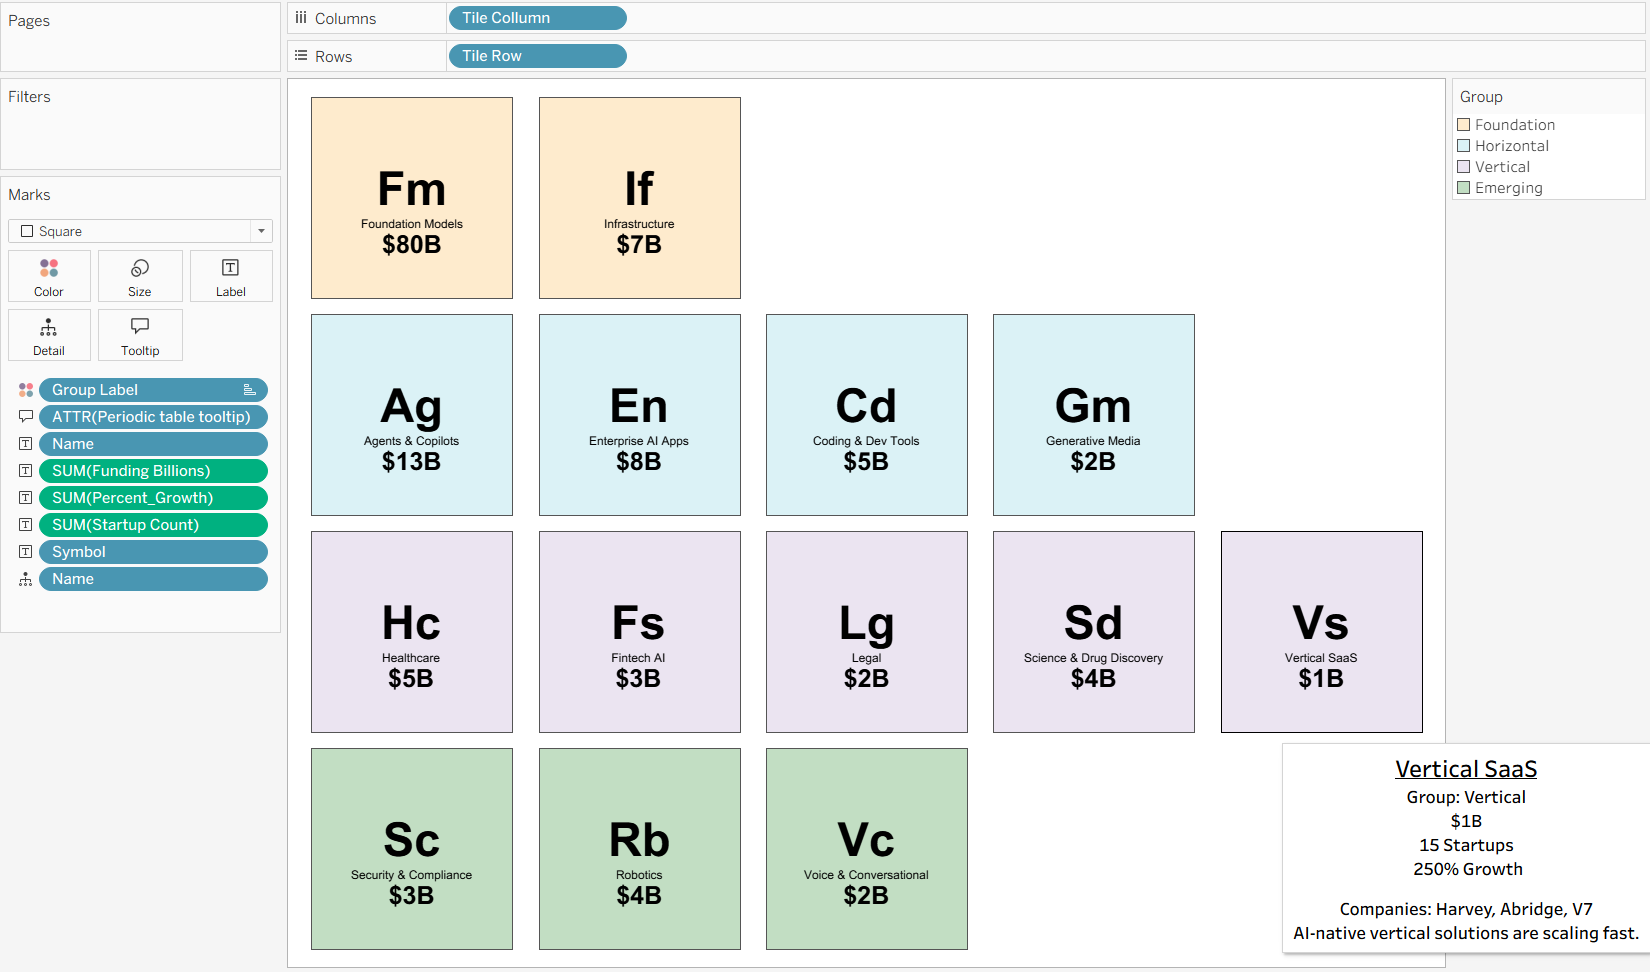
This resulted in a clean, functional layout that perfectly emulated a periodic table.
While CASE/WHEN requires more manual setup than INDEX(), it gives you full control over placement. A good rule to follow is to use INDEX() for position-based logic/auto-generated grids, and CASE/WHEN statements for a more rule-based approach when you want more control. If you’re working with data that may require a customized grid layout, using CASE/WHEN statements may help achieve your goal.
If you want to see the final dashboard, check it out here.