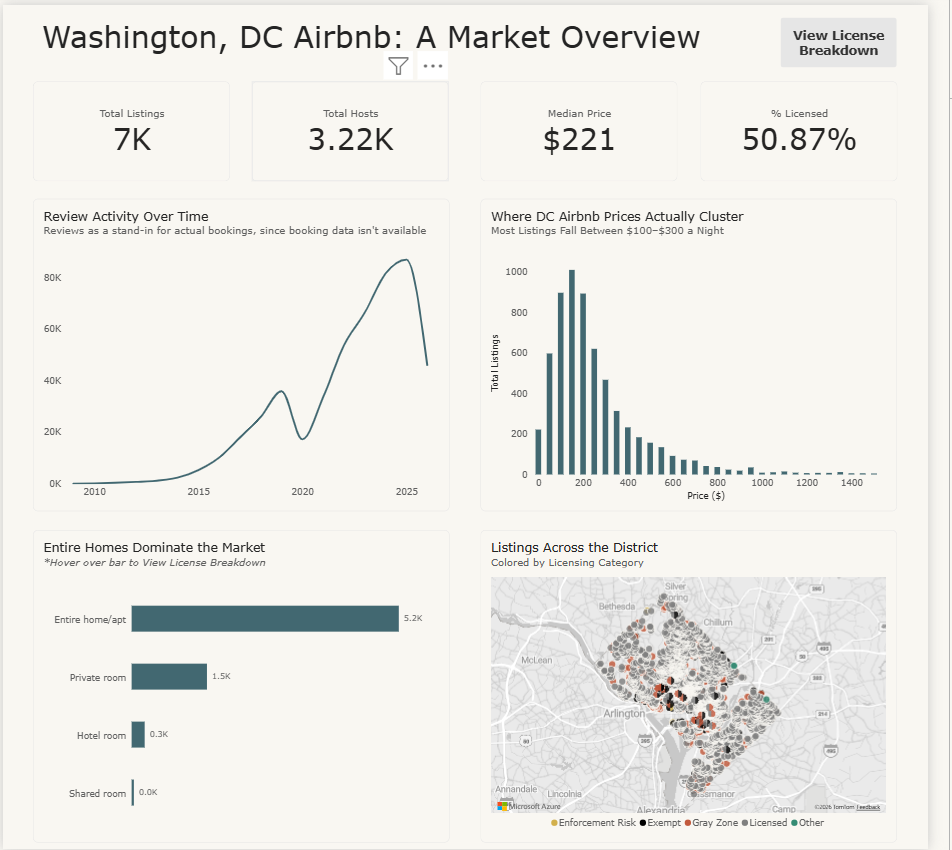
This was our first day of Dashboard week, and today we were given the option to select any city’s Airbnb data and create a dashboard in Power BI. I chose Washington, DC, as I had just spent 2 years living there and wanted to dive into their Airbnb Data.
When I started diving into the data and doing market research, I realized that Washington, DC, has very unique rules and regulations regarding host licenses and its connection to the number of cumulative nights stayed.
Essentially, Washington, DC has a restriction on who can list properties for short-term rentals ( anything below 30 days). To do so, one must rent only from their primary residence, hold a license, and not be a corporation. Anyone else, including those who rent out many properties, don’t have a license, or are not the property owner, is not allowed to host stays shorter than 30 days. This distinction divides the Airbnb market into 2 distinct groups.
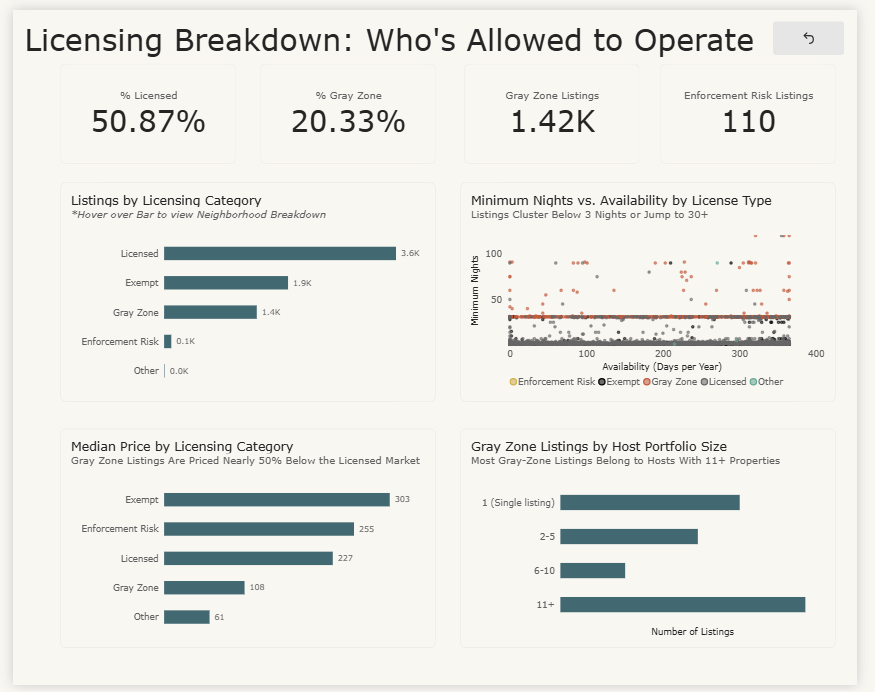
I decided to plan my dashboard around this distinction. 1 main exploratory dashboard that would provide a broad overview of the Airbnb landscape in Washington, DC, and then a second dashboard linked through buttons that would provide a more drill-down, specific look at different license types and how they may impact price, length of stay, and total number of listings each host has. I also further wanted to understand why those who were unlicensed did not apply for the license. Were they just lazy or ineligible, or did they prefer longer-stay Airbnbs?
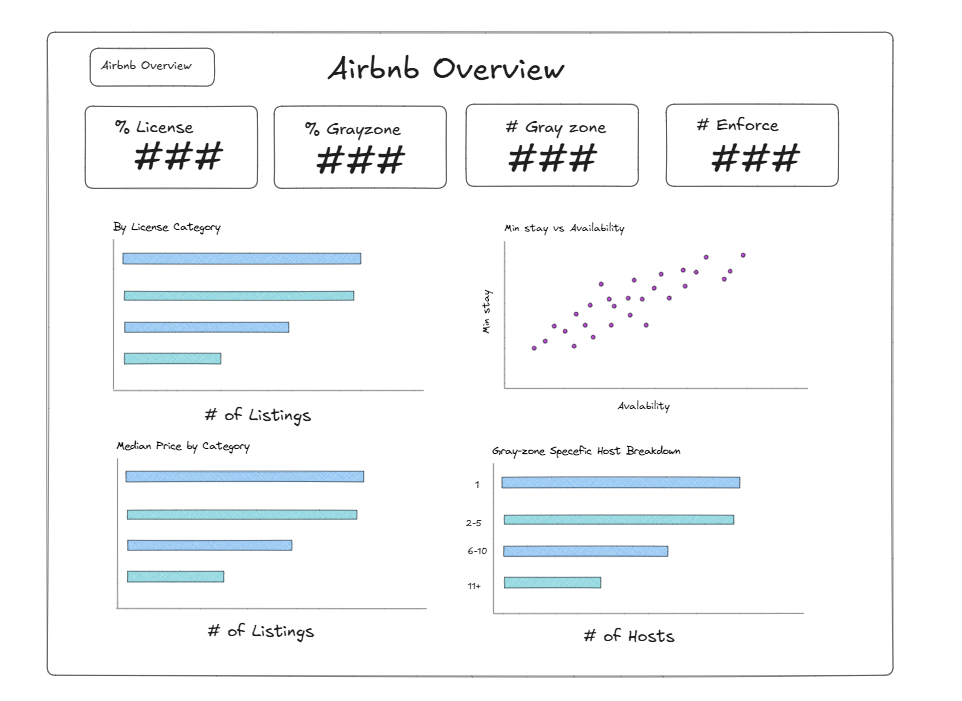
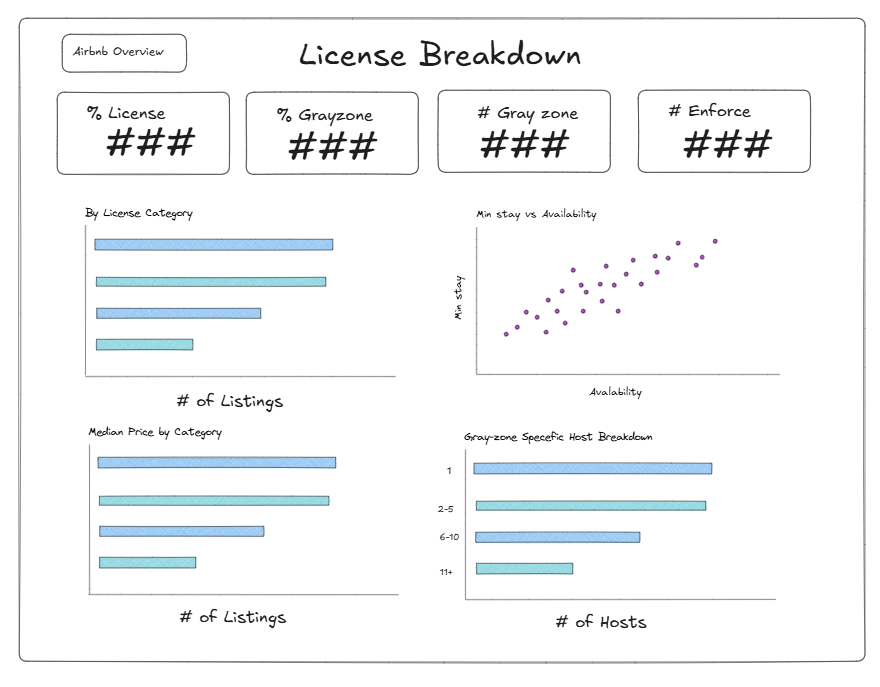
I first planned out my Dashboards in Escalidraw:
And this is my Final Power BI Dashboard: