


With this week being my cohort's final week of training, it means that it is time for our Dashboard Week! This week, despite it being a shortened week, will have each day creating a dashboard from start to finish. For today, our focus is on accessibility within our dashboards.
To start our day, we listed different aspects and elements that could lead to accessibility issues:
- Visual Impairment: Clarity, Focus, Partial/Focal/Total Blindness.
- Cultural Expectations of Flow: Left to Right vs Right to Left.
- Color Blindness: There's over 10 different kinds of it!
- Dyslexia and Dyscalculia
- Limb Differences
- Fine Motor Control
There's more than the list here, but this is what we came up with in our short brainstorming session. This led into a segment about what parts of data visualization can be used to improve accessibility: keyboard navigation, color palette, signposting, multi-encoding, and more.
As part of today's dashboard, we were provided with a few briefs based on TFL stations and London attractions. The brief I selected was focused on keyboard navigation and the accessibility that comes from it. The brief wants to assess how inclusive the city's top attractions and transport links are. The requirements for the dashboard are:
- Fully keyboard-navigable with the ability to tab through borough level filters, tooltips, and pages.
- Accessibility feature checkboxes and attraction lists.
- View summaries with no mouse interactions.
- Highlight keyboard focus areas for fast analysis.
To start, I began with a user story and sketch. My dashboard would be done in Tableau, so I started started with looking at the data provided and beginning to figure out what the final product would look like. I used Excalidraw to plan out my dashboard.
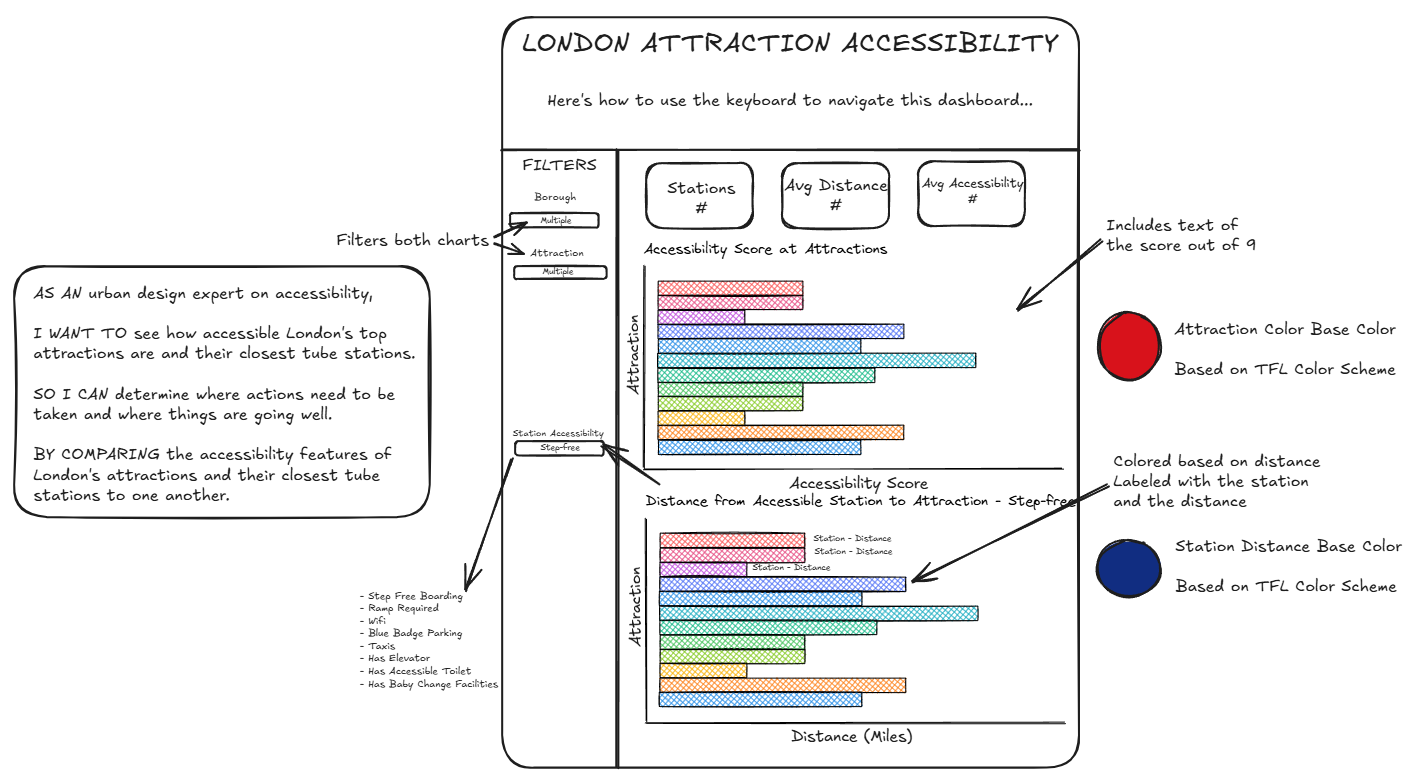
The main idea behind the design of the dashboard was to have it be easy to access and use with a keyboard. This means to reduce the number of marks possible on the chart, using as simple chart types, having a easy-to-follow structure, and consider how the user will interact with the dashboard.
One side of the keyboard navigation that I did not get to with this dashboard was using <zones> to determine the focus order to the elements on the dashboard. You can do this by editing the XML of the Tableau dashboard directly. You can do this safely by making a copy of the dashboard before making your changes. Once you are editing, you can change the id of the <zone> elements in the XML to be in ascending order of what you want to select. These are nested in the same way that the layout of the dashboard is in Tableau. However, any new saves resets the ids of the zones. Think about this in terms of the containers and elements in your dashboard. Containers, while they do have ids, do not impact the focus order. You can read more about how to edit the focus order here.
| Key Input | Use Case |
|---|---|
| TAB | Moving from one element to the next. |
| SHIFT + TAB | Moving from one element to the previous. |
| SPACE | Toggle options on buttons and filters. |
| ENTER | Navigate into charts and select marks. |
| ESC | Exit out of selection and the dashboard. |
| ARROW KEYS | Navigate within lists and pages. |
The other side of keyboard navigation comes from how you actually use the keys on the keyboard to interact with the dashboard. The main keys that you use are TAB, SHIFT + TAB, ENTER, ESC, SPACE, and the ARROW KEYS. By putting the dashboard in full screen, you can interact with the dashboard using the keyboard. An issue I ran into was how the length of the dashboard caused it to have a scroll bar, which interfered when the arrow keys were used for navigation. You can read more about Tableau's keyboard navigation here.

Overall, this was a nice project to introduce and remind myself about elements of human-computer interaction and accessibility. Other elements of accessibility were included in this dashboard (which you can find here), such as ALT text for the charts and KPIs, and the ability to download the data as a crosstab. I'm not sure what the rest of this dashboard week will look like, but I'm excited to see what else I make!