


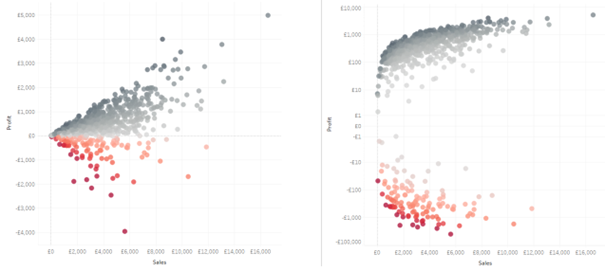
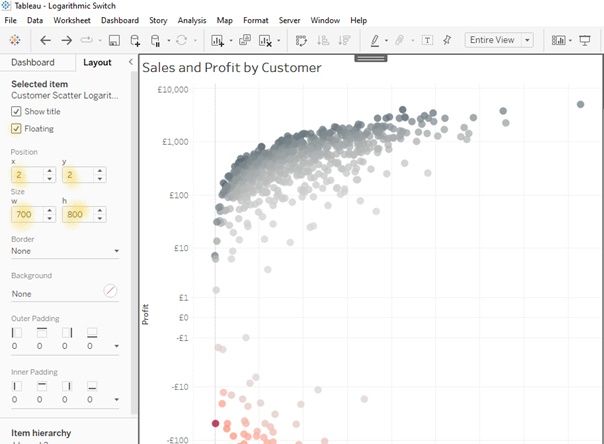
Sometimes it is difficult to decide which scale is more appropriate. The result varies depending on the setting, for example, a logarithmic scale would be more suitablefor our graph. Aslider for switching scales like this on our dashboard would be quite handy, and now we are creating one!
We use the chart from Tableau Workbook Superstore.
Step 1.
First, we create two separate sheets for each scale we want to display. We create a sheet with a linear scale and duplicate it with a logarithmic scale.
Step 2.
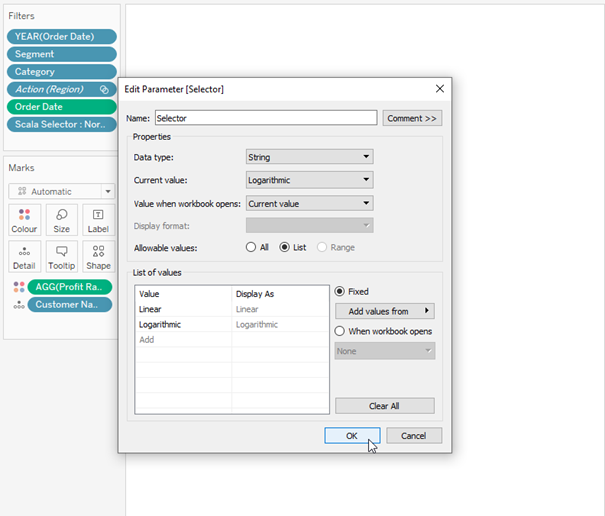
Now we will create a parameter for selection:
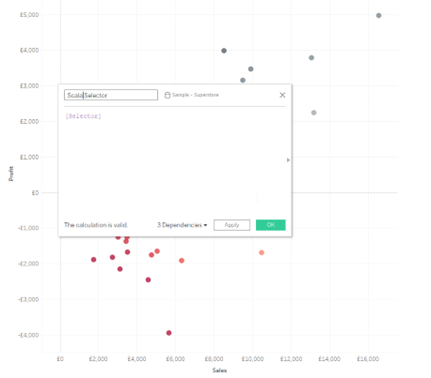
and a simple Calculated Field for Scale Selector:
Step 3.
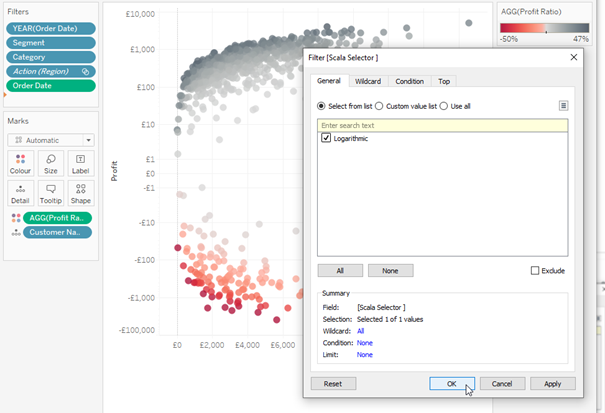
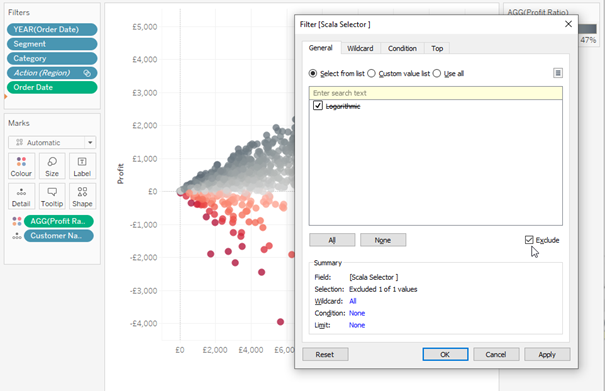
On the sheet with the logarithmic scale, we'll place our Scale Selector in the filter and select "Logarithmic". On the sheet with the linear scale, repeat the process and select "Logarithmic" -> "Exclude":
Step 4.
Next, we individually add each sheet into the same (important!) container:

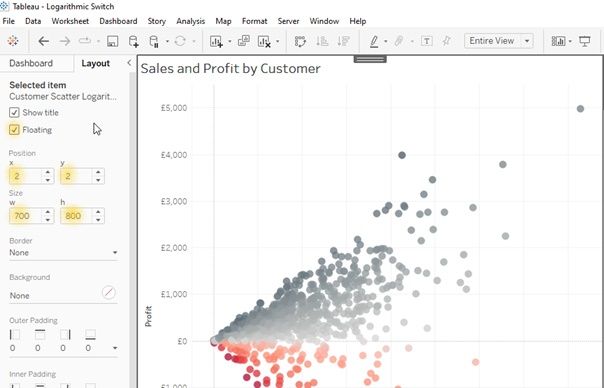
The sheets within the container must lie exactly on top of each other. If this doesn't work when dragging and dropping, we can make our objects floating and fix their size and position:
Then hide the headers of both graphs.
Step 5.
Add our selection parameter:
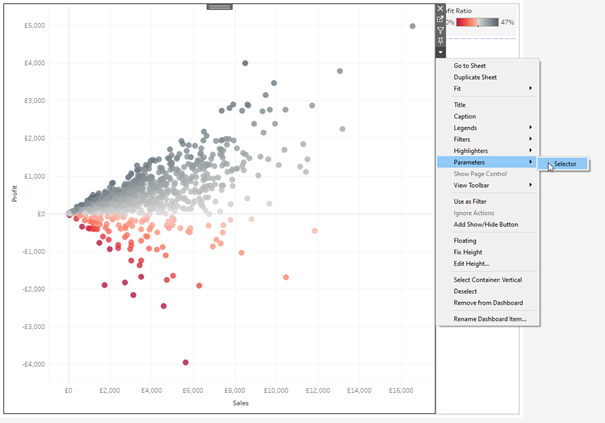
Voila! Now we can select between both scales!
This Workbook on Tableau Public