


The task set was to produce a dashboard using the IMBd dataset set in Tableau's Movie + Data challenge. There was a lot of free scope in what we could produce, with the only caveat being to have a unique story from each other and to stay within the terms and conditions of the challenge.
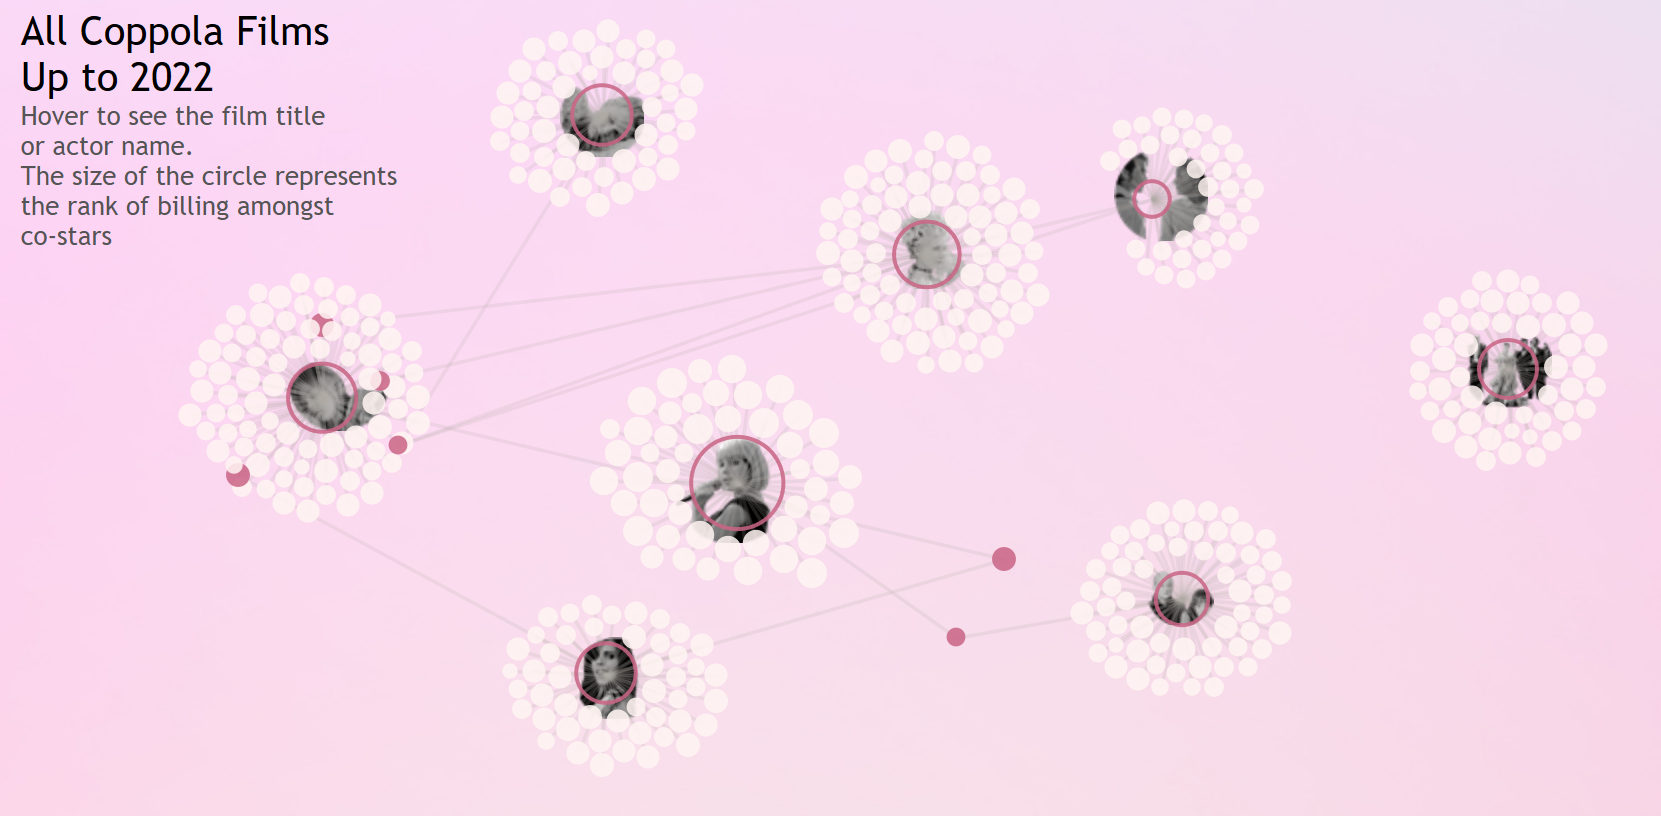
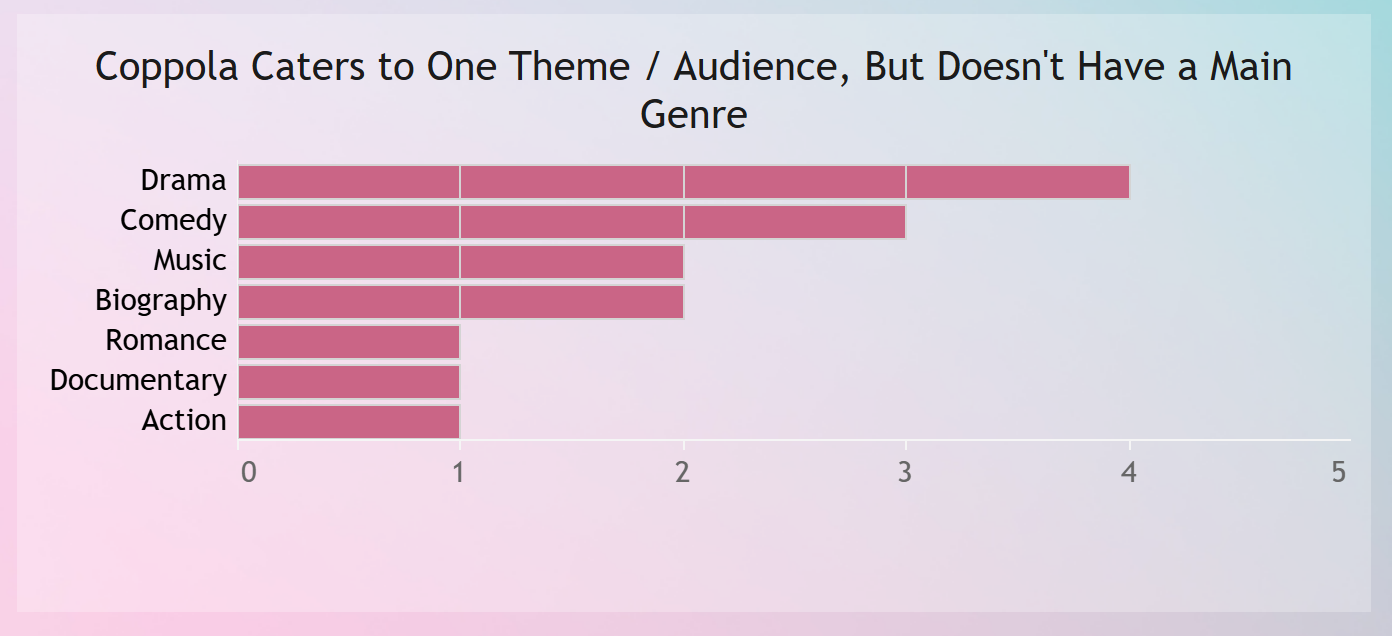
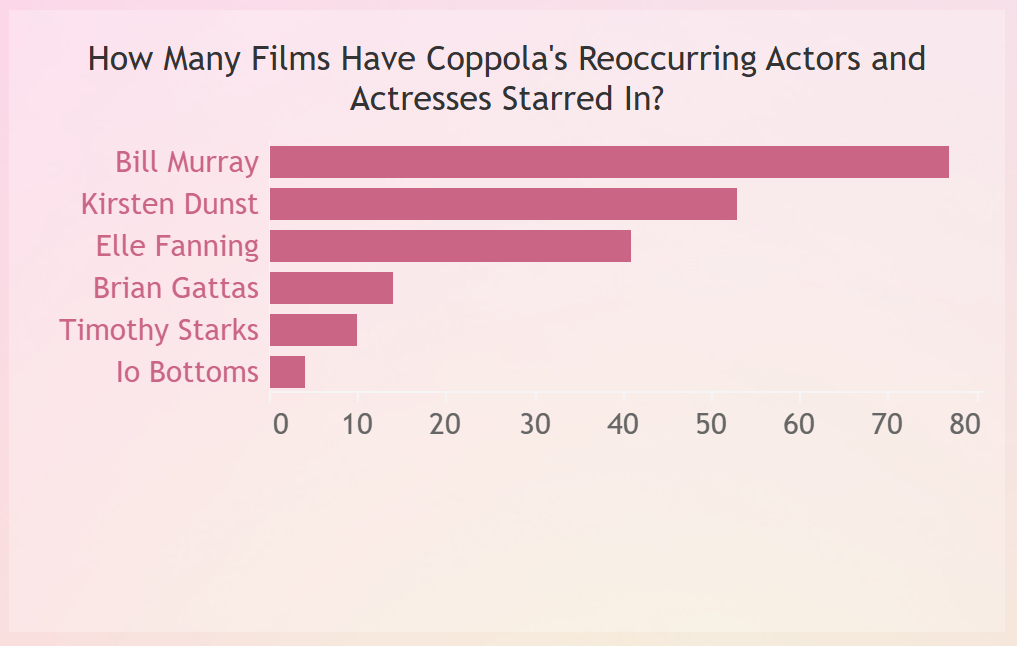
I planned to narrow the focus to one of my favourite directors: Sofia Coppola. As her films have a distinct theme across the board, and are tailored to a specific audience I was intrigued to see what actors star in the films and if they have had success in other film genres.
The Plan

Setting the Context
I used a bold title with contextual information to set the story of the dashboard.
Additionally, to bypass the copyright-free image I followed Asha's blog [https://www.thedataschool.co.uk/asha-daniels/positioning-shapes-in-tableau/] which utilises shapes in Tableau to match X and Y data points of the image you desire. This helped me create a line art-style picture of Sofia Coppola without using any paid images.

Network Chart
I followed this tutorial [https://youtu.be/A9MP2MJpyQc?feature=shared], to create a JSON file of my data, and reshape it so I defined each node as a source or target to create links between them.
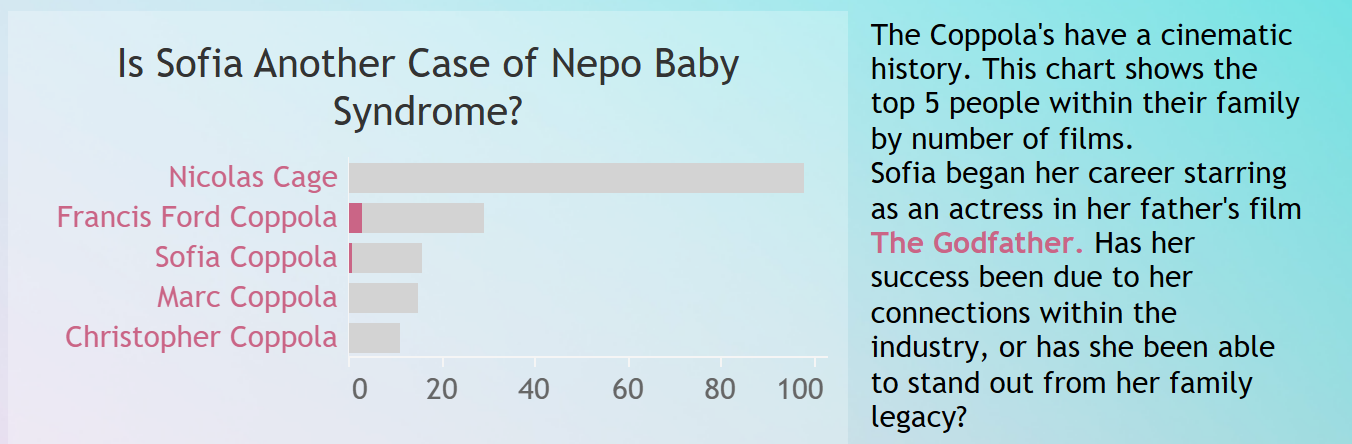
Bar Charts
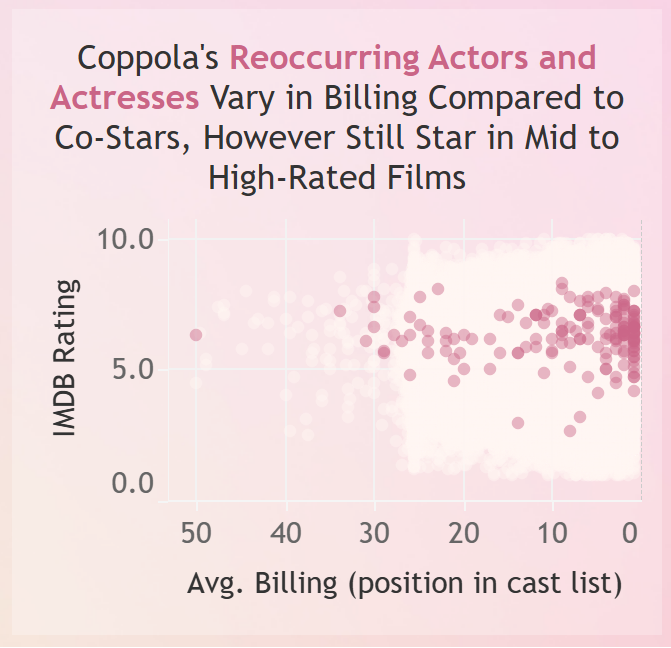
Scatter Plot
The Challenges
I was using a large dataset supplemented with additional data sources within my workbook, which ultimately prevented me from uploading to Tableau Public, as the server kept failing on upload. My next steps are to filter the data in Tableau Prep and remove any fields I am not using to condense my data set.