


When you think of Tableau, your first thought may be Tableau Desktop or Public, interactive dashboards and visualisations. However this is only one aspect of large ecosystem designed to help you prepare data, share insights, collaborate with others, and even use AI to answer questions about your data.
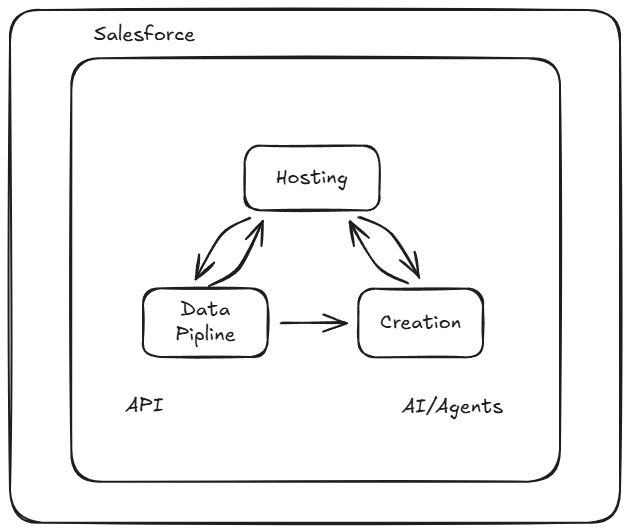
This blog will explore all the components of the Tableau ecosystem (illustrated below), and show how they work together.
Salesforce
Salesforce acquired Tableau in 2019, and have become deeply integrated:
- Data Source- Organisations use Salesforce CRM (Customer Relationship Management) to manage customers, accounts and cases. Tableau can connect directly to Salesforce allowing you to build dashboards and analyse CRM data
- An ecosystem- As Tableau is a part of the Salesforce platform (including Slack, Data cloud), it allows Salesforce users to view, analyse and share dashboards without leaving Salesforce.
Hosting
Hosting is the central hub of the Tableau ecosystem. It stores and manages published dashboards, workbooks, and data sources, allowing teams to access secure content from a single location. Hosting can be categorised into:
- Tableau Server- Installed and managed by your organization
- Tableau Cloud- Fully managed, cloud-hosted service maintained by Tableau.
Data Pipeline
Data pipeline is the process of collecting, preparing, and transforming raw data so it is ready for analysis. This process will likely involve cleaning data, combining multiple sources, fixing errors, and reshaping it into a consistent format.
The software which allows for this is Tableau Prep. As well as preparing data, this tool allows for building data flows which automates these tasks. The cleaned data sources can be published to hosts such as Tableau Server and Tableau Cloud.
Creation
Creation is the process of building visualisations and dashboards from your data. The two platforms which allow you to do this are:
- Tableau Desktop
- Uses Drag and drop analysis, which allows users to build a range of charts, maps and reports. In the form of sheets, dashboards and stories.
- Can connect to over 90 data source from local e.g. (excel, text files), servers (e.g. MySQL, Oracle) and cloud platforms (e.g. Google, amazon).
- Fully licensed for business and commercial operations.
- No arbitrary data limitations.
- Tableau Public
- Free web based platform, with similar features to tableau desktop. Allows for the creation and sharing of interactive data visualisations.
- Connects to mostly to local files. Dashboards cannot be connected to live databases.
- Used for community and learning (Non commercial)
- Data size limits 15 million rows or 1GB data
AI Agents
Tableau Agent/AI helps users to explore and understand their data, it does this by:
- Allowing users to ask questions and receive AI-generated insights
- Identifying trends, and get explanations of key metrics
- Working with data and content published in Tableau Server or Tableau Cloud
Embedding and APIs
Embedding and APIs (Application Programming Interfaces) allow Tableau to connect with other applications, acting as the connecting layer in the ecosystem.
APIs allow systems to communicate with Tableau. Meaning organisations can automate tasks, manage content, and integrate Tableau functionality into their own solutions.
Embedding allows Tableau dashboards and visualisations to be displayed directly within other applications without needing to open Tableau separately.
Hopefully now you have a better understanding of all the components of the Tableau Ecosystem, and you can see how they work in tandem!