In Power BI calculations are written in DAX (Data Analysis Expressions). Here I will discuss some of the more complicated functions such as: Iterative, Time Intelligence and filter context functions.
Iterative functions
So what are iterative DAX functions? DAX iterative functions (usually identified by the 'X' suffix) are functions that calculate expressions row by row and then aggregate to produce a final number.
The most common iterator functions include:
SUMX– sums a row-by-row expression
AVERAGEX – averages a row-by-row expression
COUNTX/ COUNTAX – counts rows based on an expression
MAXX / MINX – returns the max/min of a row-by-row expression
RANKX– ranks values based on an expression
Syntax
So now that you know what they are, it is import to know how to write them. These functions should follow the syntax pattern show below.
FucntionX(<table>, <expression>)

What is going on behind the scenes?
It may be hard to conceptualise what is actually going on 'table wise. So here is a break down of what is happening behind the scenes using the same example expression shown in the equation above.
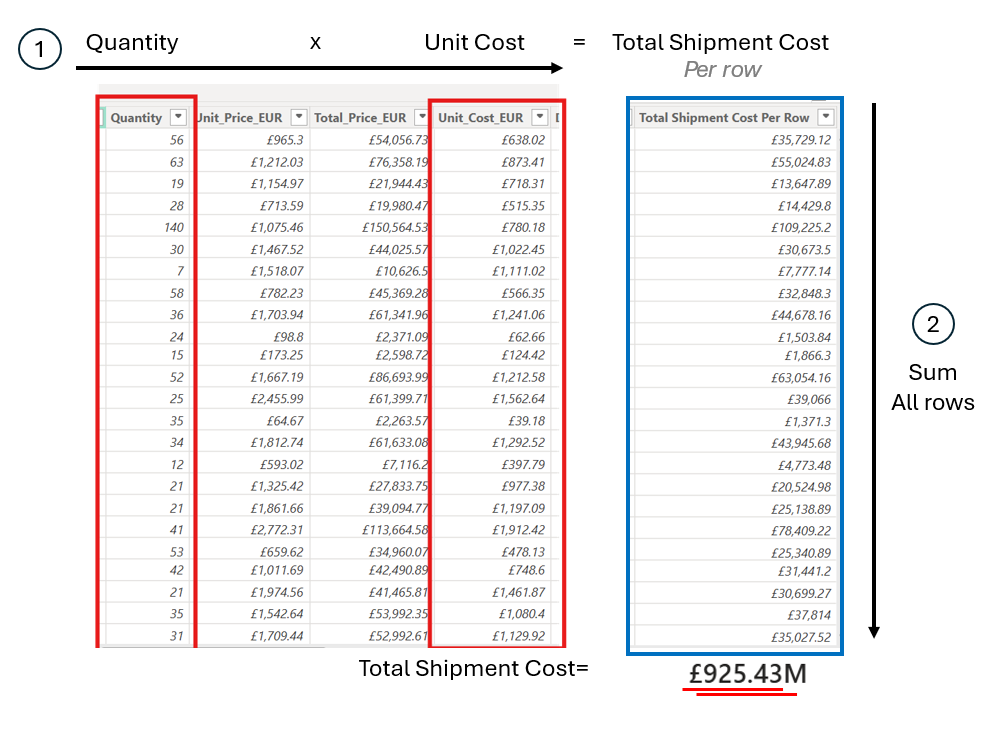
Firstly the expression is multiplying the two columns, shown in red, for all rows. You can think of this as creating an 'intermediate column' shown to the right. However this column is not actually created within the table. Next the sum is calculated of the 'intermediate column', for all the rows to produce a final value.
Time Intelligence Functions
You have probably heard of and used general date/time functions, these functions enable time intelligence functions. Time intelligence functions are specifically built for date comparisons and cumulative calculations.
The most common time intelligence functions include:
DATEADD- Shifts a date range forward or backward by a specified number of periods
SAMEPERIODLASTYEAR- shifting a date range back exactly one year
DATESYTD- Returns all dates from the start of the current year up to the latest date (year-to-date)
DATESMTD- returns all dates from the start of the month up to the latest date
DATESBETWEEN-Returns all dates between two specified date
What is going on behind the scenes?
These functions can be used to add a measure or column (see here for a description on the difference).
If you create a column, a new column will created in the table of choice.
If you create a measure however, it would be as if a single-column table was created, containing date values from the column you referenced.
Syntax
DATEADD(<dates>, <number>, <interval>)
SAMEPERIODLASTYEAR(<dates>)
DATESYTD(<dates>)
DATESMTD(<dates>)
DATESBETWEEN(<dates>, <start_date>, <end_date>)
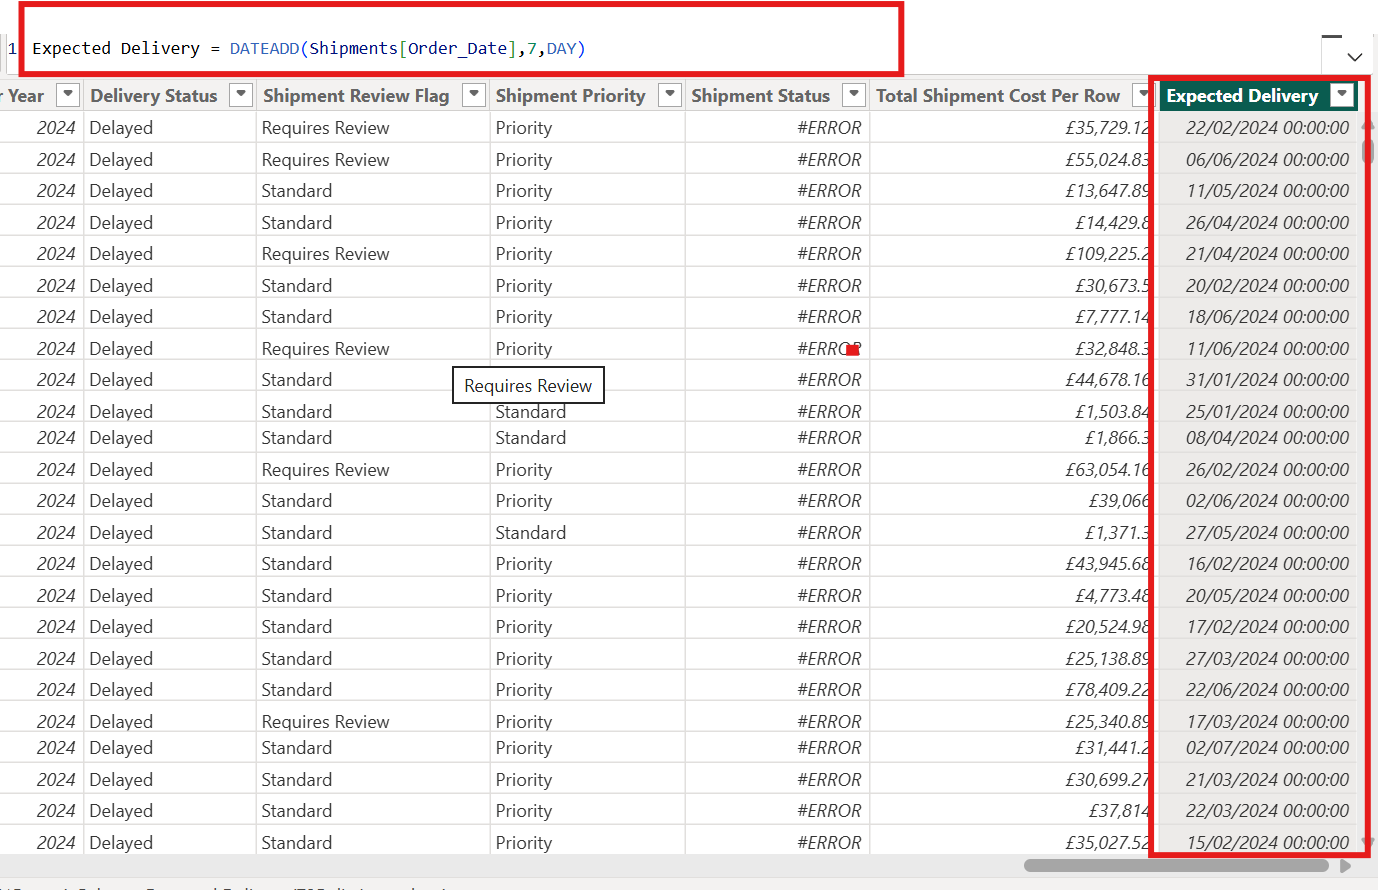
For example, lets take a look at the DATEADD function by creating a column. Let's think about if we were expecting the order date of a product to be delivered a week after the order date. The equation follows the structure DATEADD(<dates>, <number>, <interval>). The date would be order date, the number would be 7, and the interval would be days. Power BI will prompt you to select the interval.

Filter Context Functions
So now that you have seen a few functions, it is useful to know that you are able to modify the context that an expression is evaluated in. The functions that help do this are called filter context functions.
There are two main types of filter context functions:
CALCULATE - evaluates an expression under a modified filter context.
CALCULATETABLE - the same as calculate but it returns a table instead of a value.
Syntax
Like before, it is important to understand how to write this type of calculation. There correct syntax is shown below.
CALCULATE(<expression>, <filter1>, <filter2>)
CALCULATETABLE(<table>, <filter1>, <filter2>)
Example
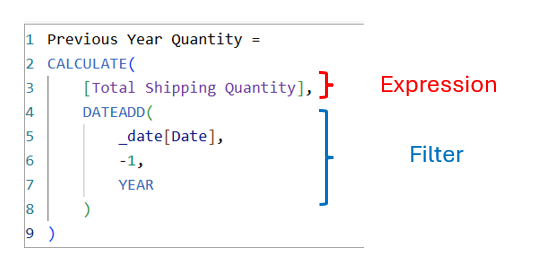
Here is an example of what a measure using CALCULATE DAX would look like. It incorporates the DATEADD calculation, from the last example in the Date Time Calculations. This calculation is calling to Calculate the total shipping quantity, filtered to the year before.
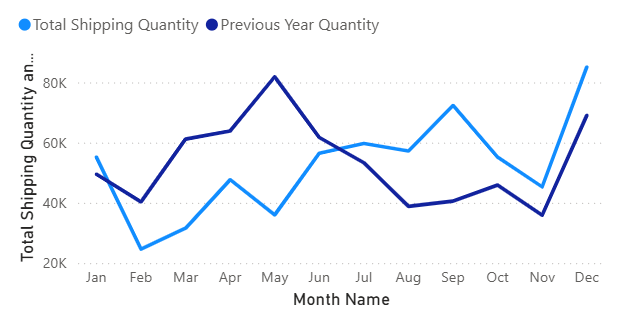
If you were to plot the resulting measure, along side the current year Total shipping, you would expect to see something like this.