


This blog will discuss the data preparation used to create the dashboard on global remittances shown below.
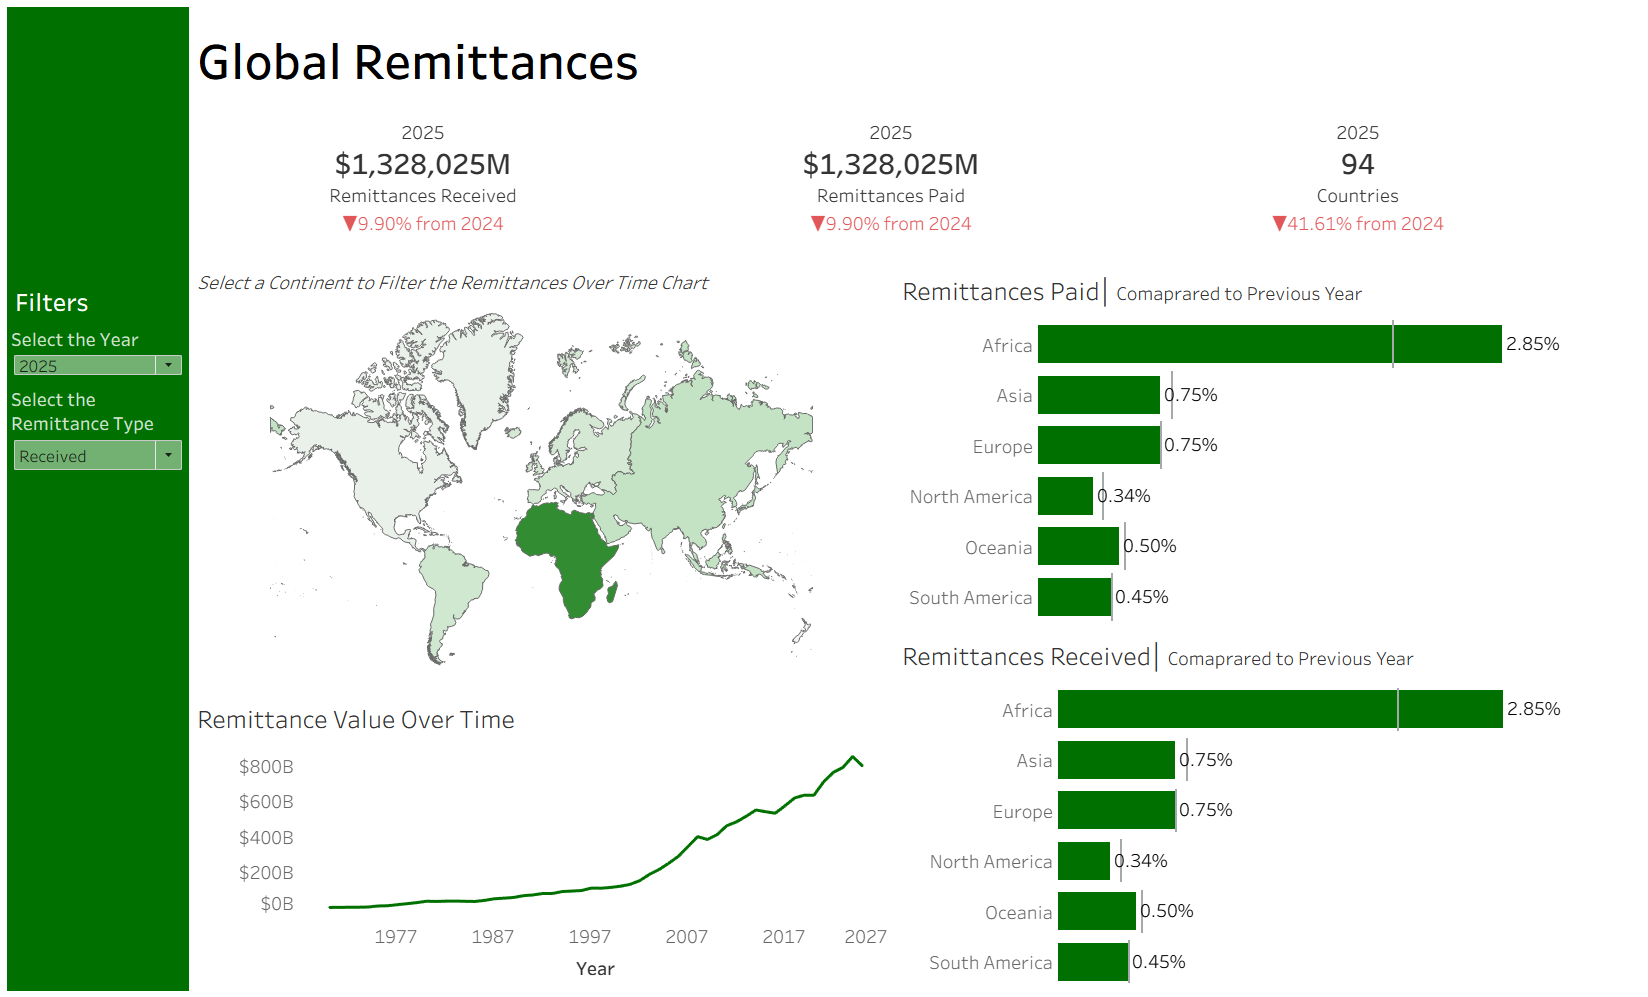
There were 3 separate data sets on remittances paid, remittances received and the Gross Domestic Product for each country.
Data Prep
Here is an example of the Remittances Paid Table.
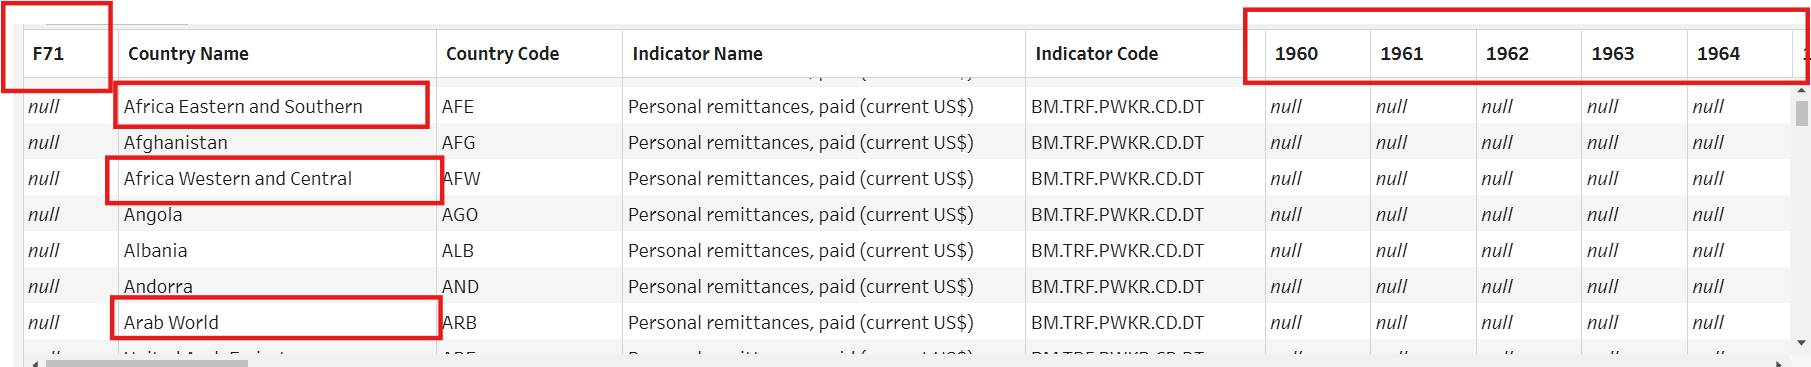
You will notice a few things will need to be changed, for the visualisation and analysis:
- The unnecessary columns
- The Granularity of the data, regions and countries are both shown
- Remittance values for all years are shown across one row
Tableau Prep
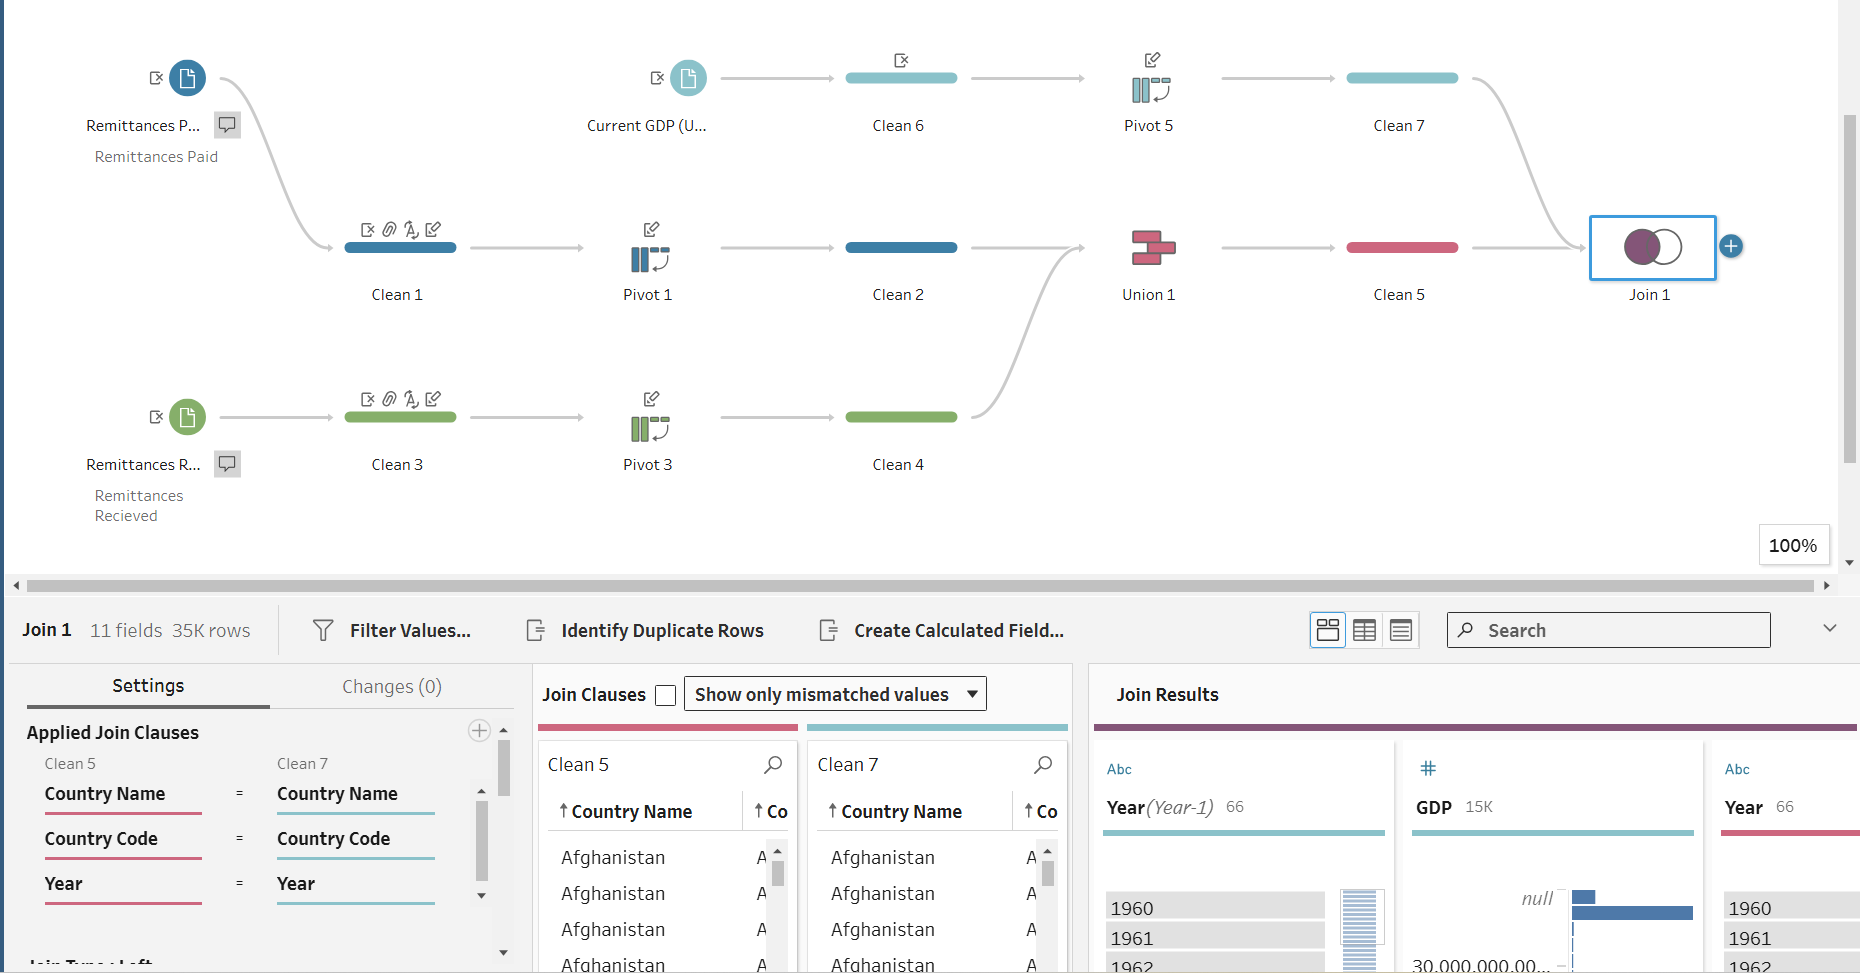
To tackle all the issues stated above, the Data was prepared in Tableau Prep, using the flow shown below.
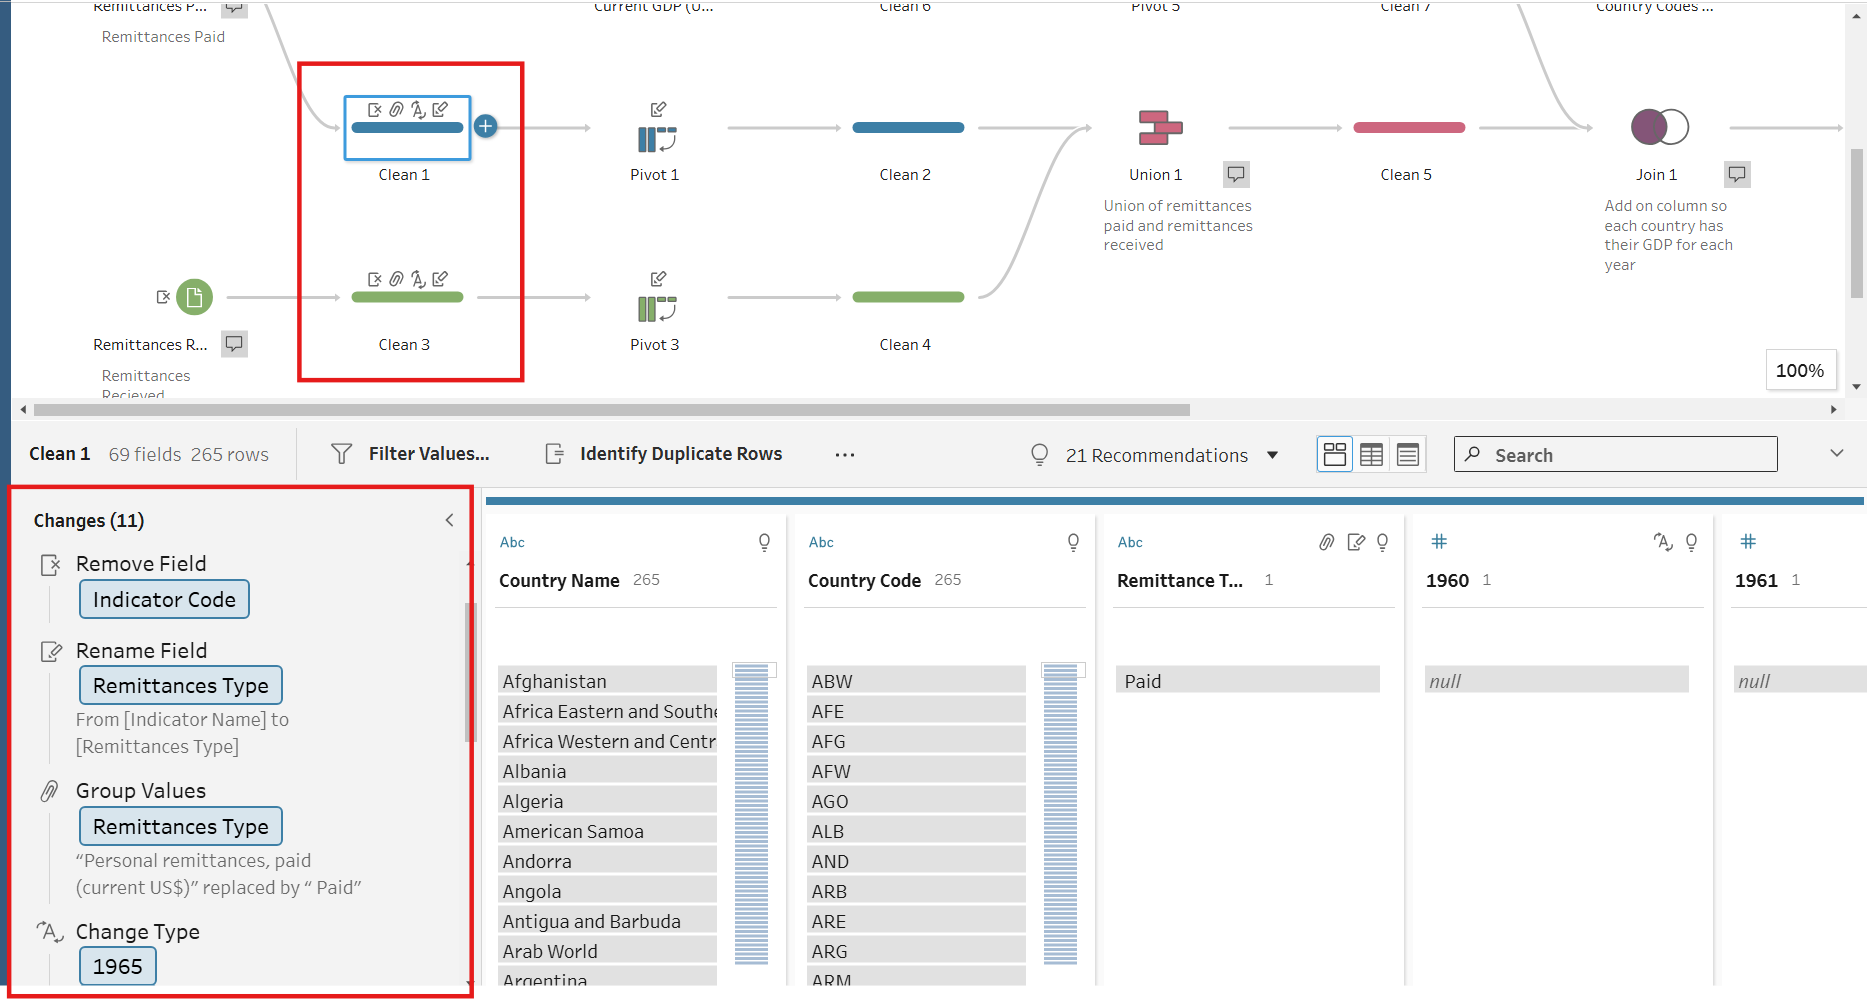
Step 1- For both the remittances paid and received data sets, unnecessary headers were removed, columns were renamed and all years were changed to the same data type (integer) user the clean step.
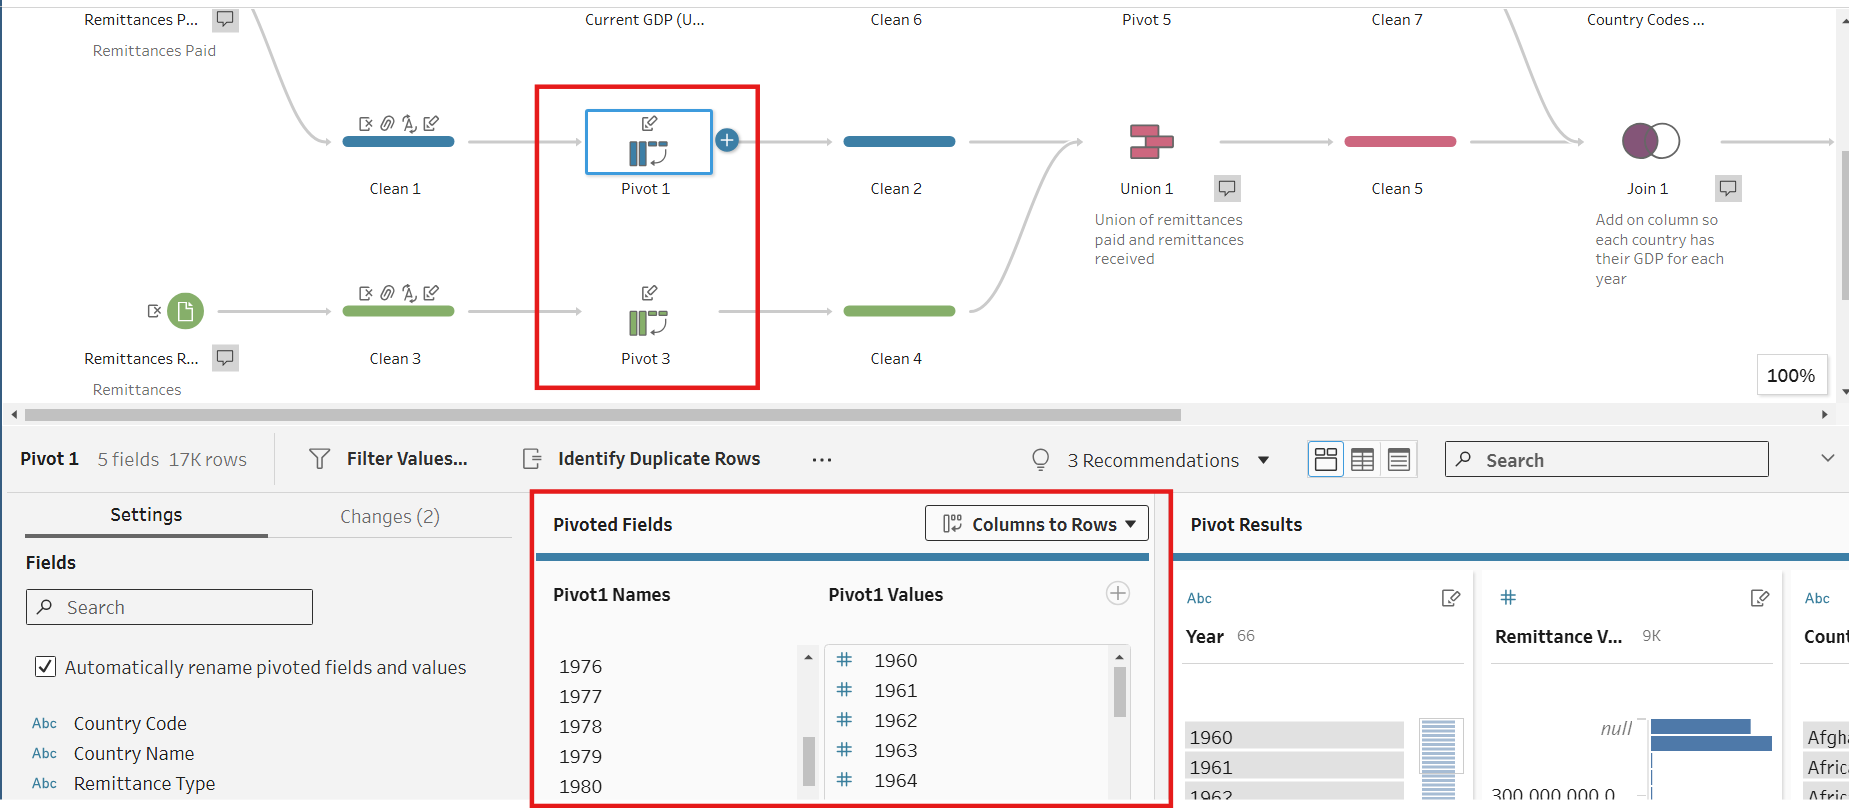
Step 2- For both the remittances paid and received data sets, the years were converted from columns to rows using the pivot step.
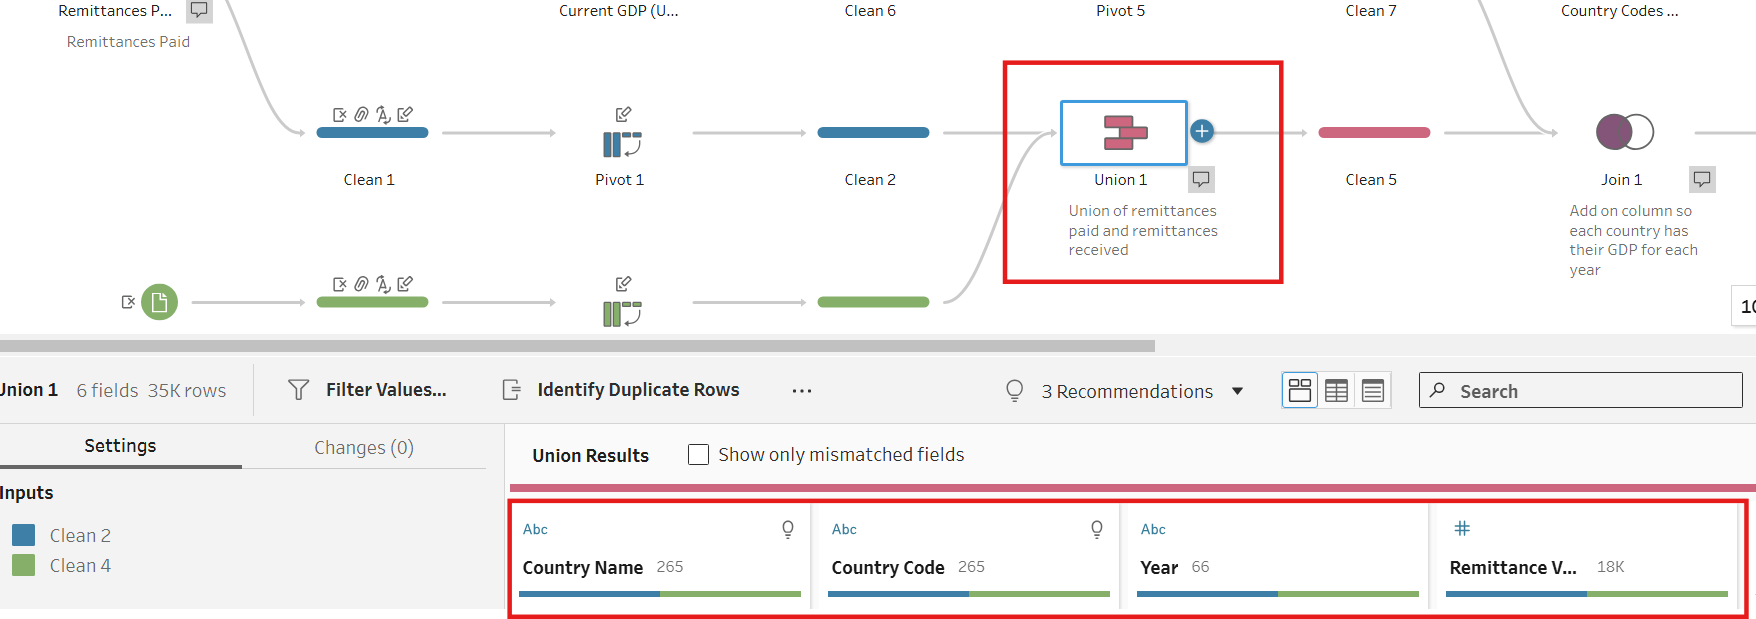
Step 3- As both the remittances paid and received tables had the same headers, they were stacked on top of each other using a union step.
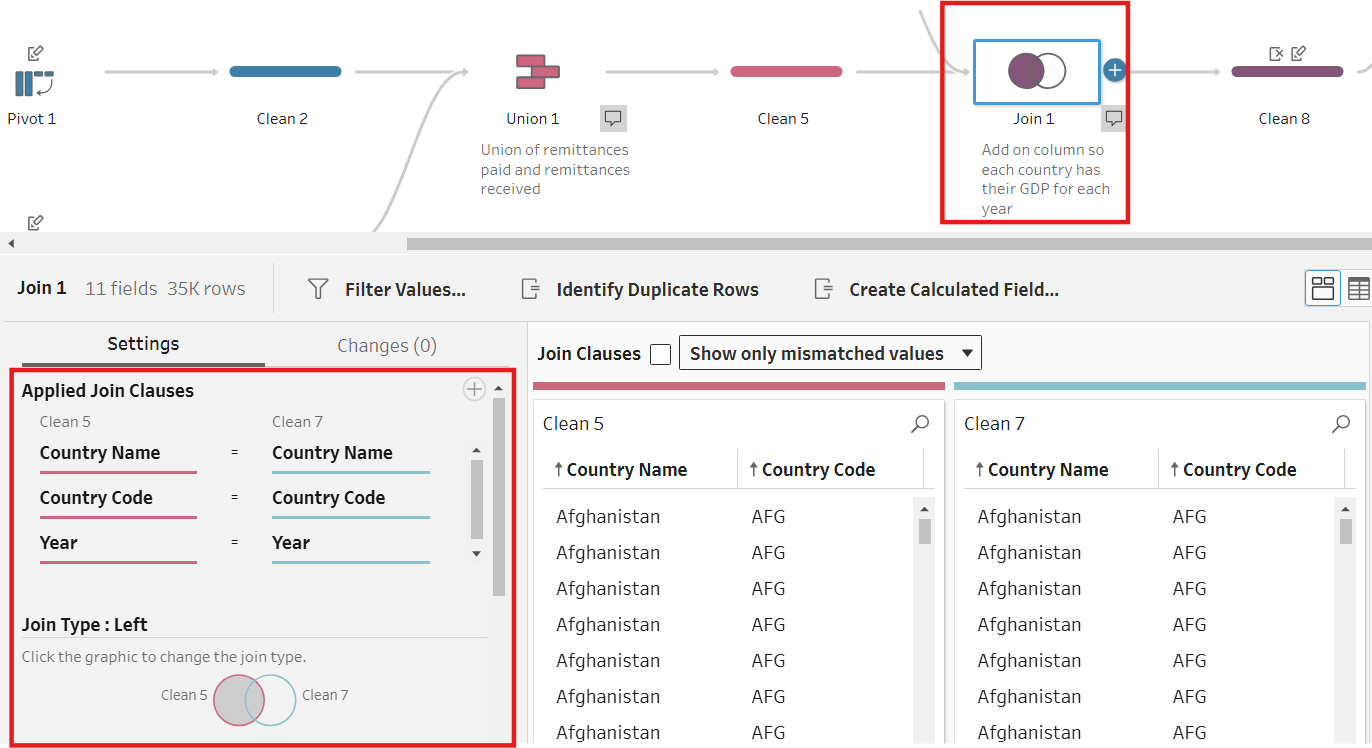
Step 4- In order to compare the remittance values, the GDP values had to be introduced to the data. To do this a left join was conducted from the unioned remittance data to the GDP data. The join conditions were the years, country and country code, as these fields define the granularity of the data.
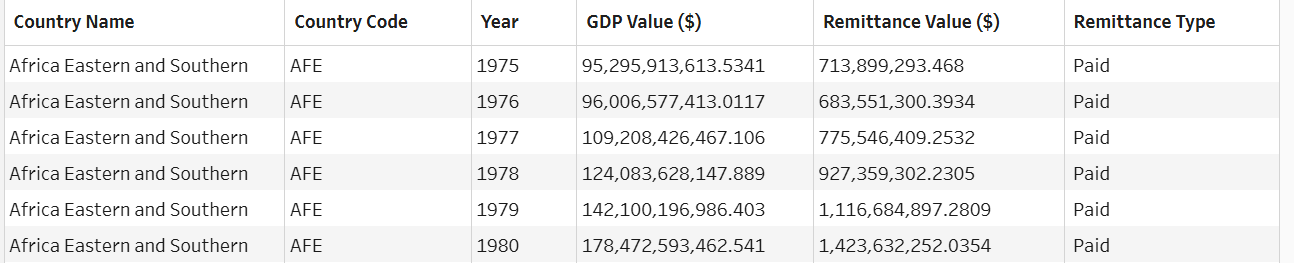
Below is a sample of what the prepared data looks like.
Preparing for Spatial Analysis
The dashboard also requires the data to be shown at a continent level. However the current data, has a row per country or region per year. So this needs to be tackled.
Download Shape -In order to view the continents on a map, the shapes for each continent needed to be downloaded (as a shp. file). The link is shown here: (https://figshare.com/articles/dataset/Continent_Polygons/12555170 ).
Connecting Shape- Now that the shapes for each continent have been downloaded. It will need to be connected to the prepared data in Tableau desktop. However before this can happen, both the shape file and data need to have a field in which they can forma relationship on. To do this I will relate the data by continent. This is not currently a field in the data set. So I will introduce this to the data by joining onto another dataset which has this information available.
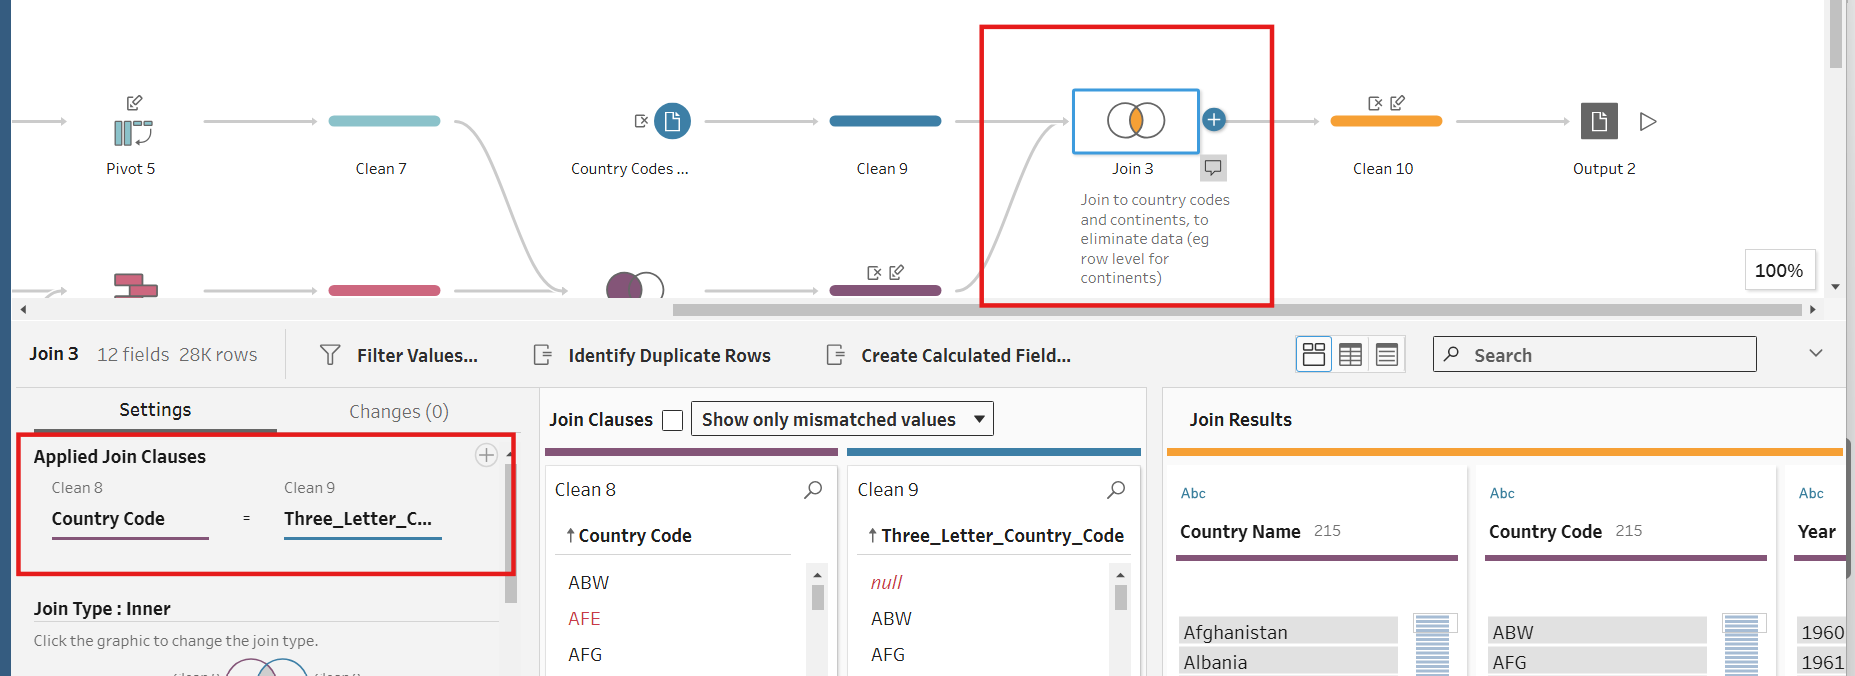
Here I conducted an inner join and joined on the 3 letter country codes. This would eliminate any rows from the original data that are not at the country level (eg regions) and bring in the continent data.
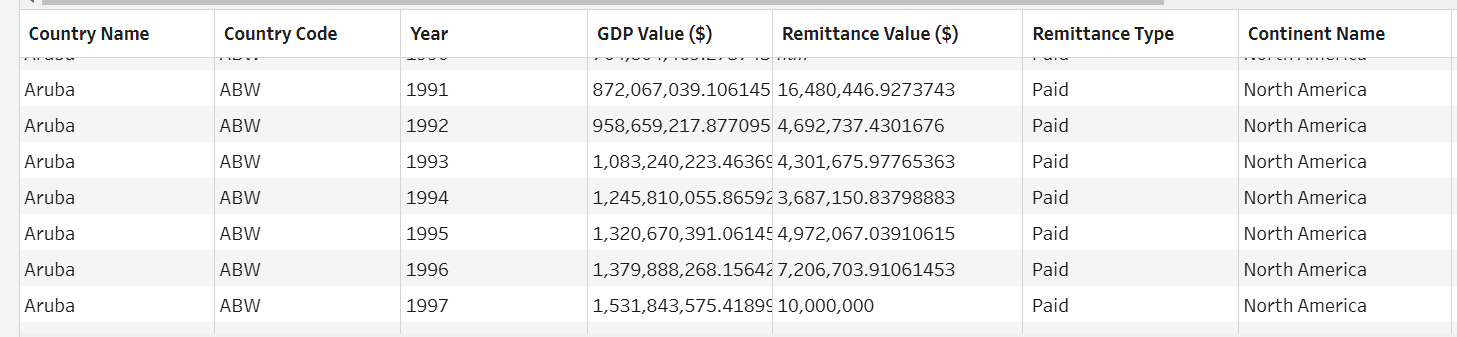
Here is an example of what the final restructured data looks like.
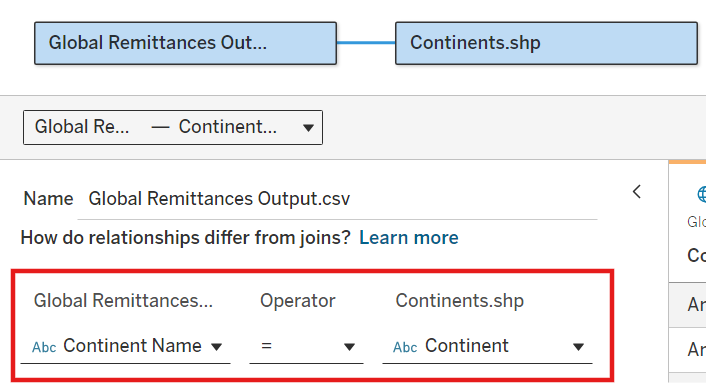
Now that the Continent is present in the data it can be joined to the shp. file in Tableau Desktop and used for Spatital analysis.
Data Sources
Personal Remittances (Paid)
https://data.worldbank.org/indicator/BM.TRF.PWKR.CD.DT
Personal Remittances (Received)
https://data.worldbank.org/indicator/BX.TRF.PWKR.CD.DT
GDP
https://data.worldbank.org/indicator/NY.GDP.MKTP.CD
Country Codes and Continents