In Power BI there are two types of calculations, Columns and Measures. Both are created using Data Analysis Expressions (DAX).
Columns
what are they?
Columns are calculations which are calculated row by row in a table. It produces a new column and is stored within the table. These calculation values are fixed.
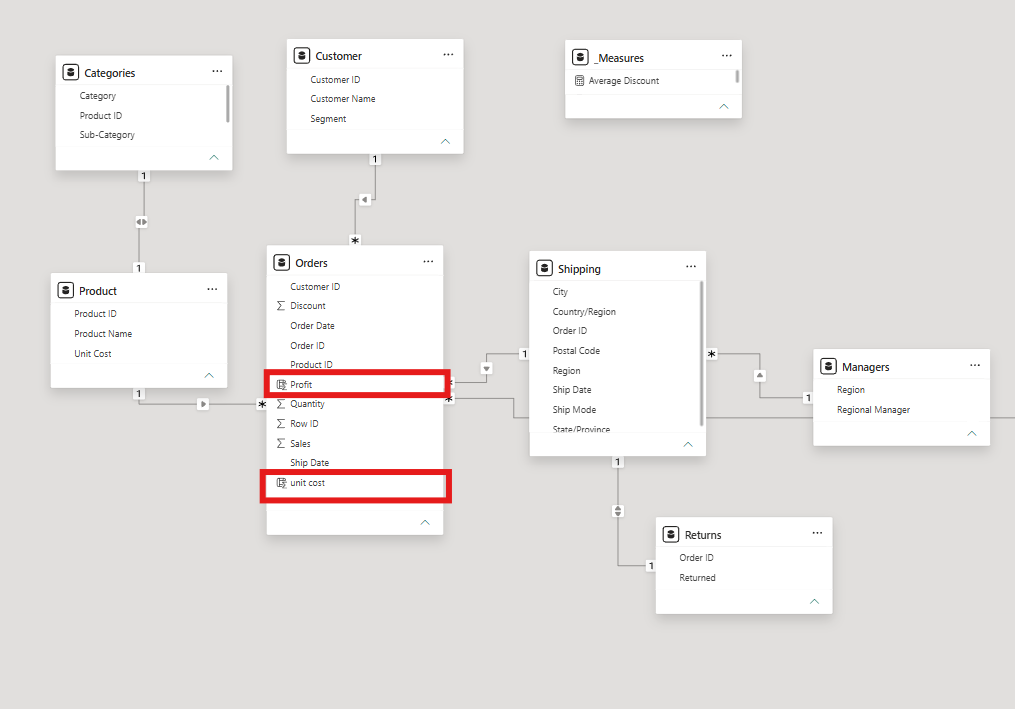
When looking in the model view, these column will appear within the table headers and is indicted by the table & Sigma icon.
Common uses:
-Create Values needed in axis or slicer
-Concatenating fields (e.g Name 1 + Name 2)
-Row level classifications
How to write the calculations?
Step 1: Select the table of interest from the Data pane, and Select new measure under table tools.
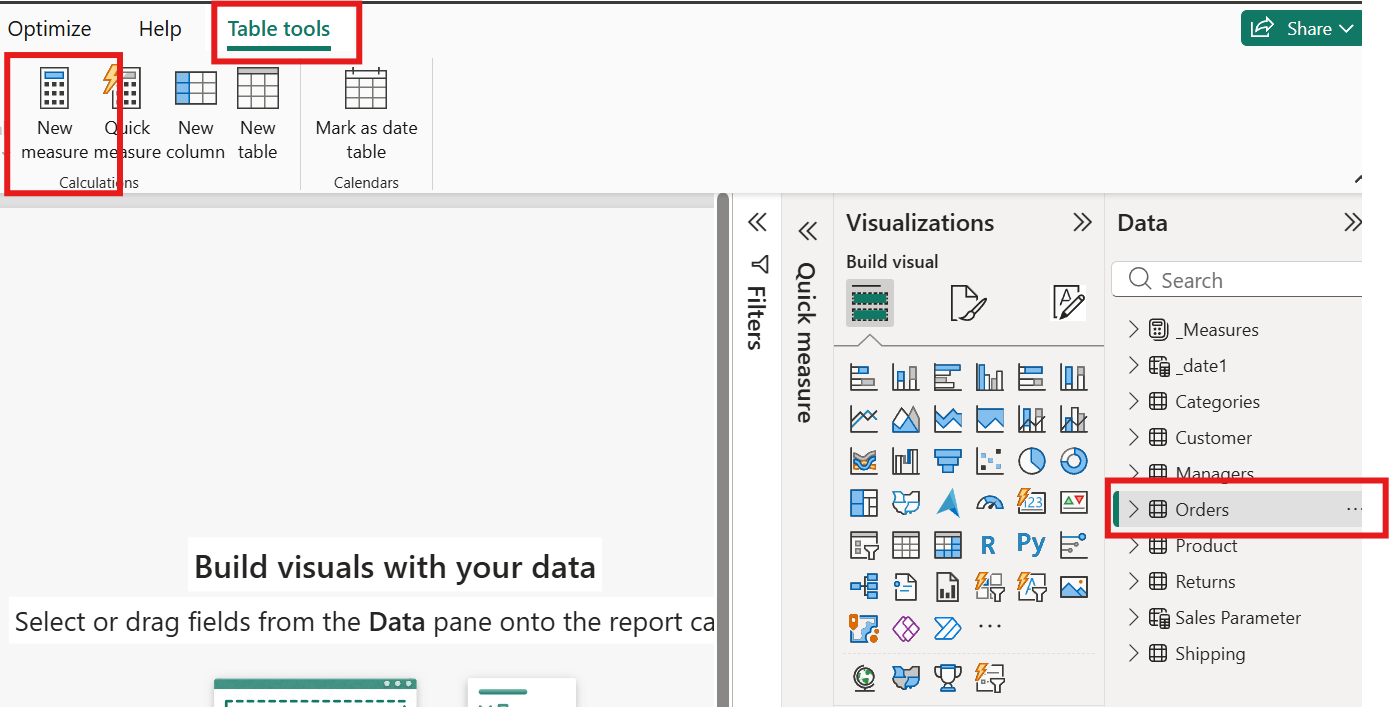
Step 2: A DAX box will appear under the tool bar. Name the measure accordingly and type in you function. As this calculation will be calculated at row level, you are able to refer to other columns in the table directly.

Step 3: To verify your calculation, check within the table view. The new column should appear, and the values should match the calculation

Measures
What are they?
Measures are calculations that are generated in the moment, and produce a single value. These calculation values are subject to change depending on the filter context applied.
They are not stored in tables you can think of them 'floating'. When looking in the model view measures will not have any relationships within the schema.
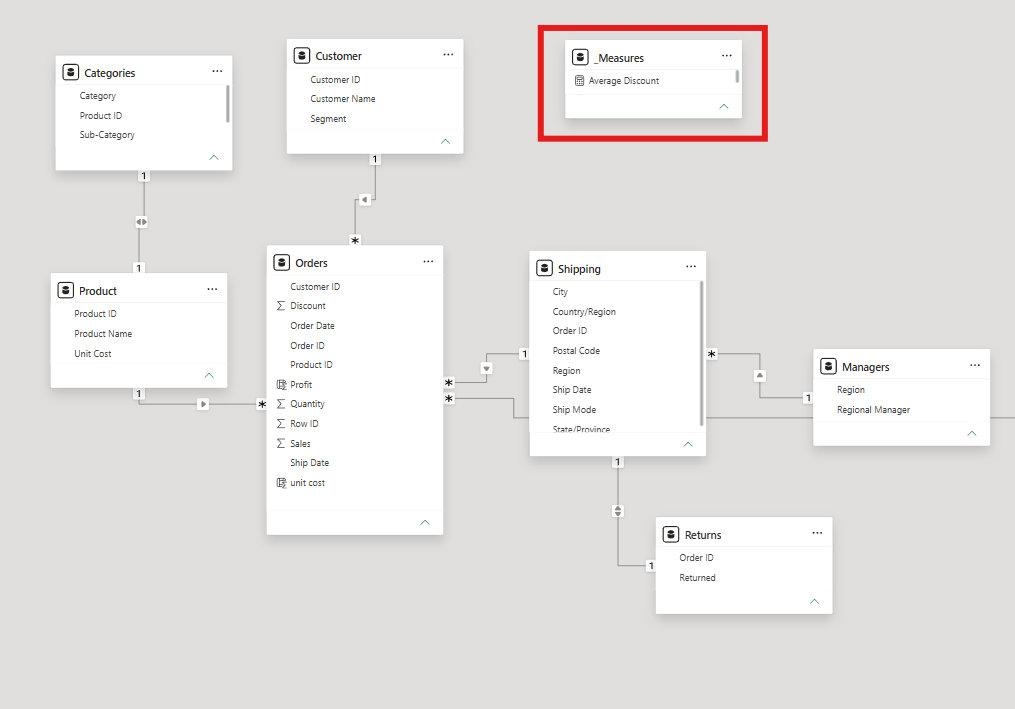
Common Uses
Measures are commonly used to calculate:
- Totals, Averages, Ratios
-KPIs
-Year comparisons, running totals
How to write the calculations?
Step 1: Before creating the new measures, a new measure table should be created, where all measures will be stored. This will allow all new measures to be easily tracked. Select enter data on the toolbar, under the home tab.
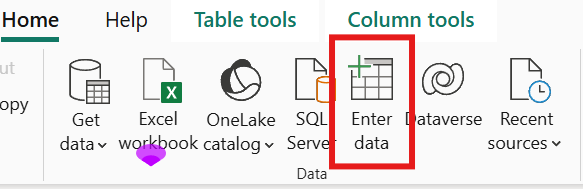
Name the table Measures or Measure table. Use prefix '_'. this will allow you to always see the measures at the the top of the data pane.
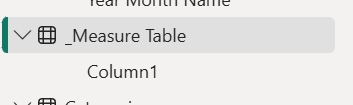
Step 2: Now you have a measures table you can create measures. To do this ensure the measure table is selected (to ensure the measures will be stored in this table), and select new measure.
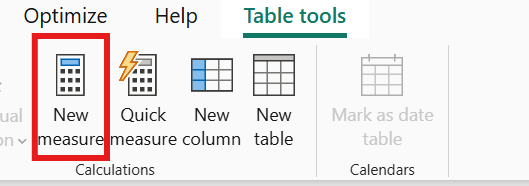
Step 3: The DAX box should appear under the tool bar. As this calculation should return a single value, it needs to have some sort of aggregate logic.
This means that if attempting to refer to a column directly, as done in Column calculations, DAX would not know which row you meant. As a result, the rows will need to be collapsed into one number using aggregation functions such as: SUM AVERAGE, COUNT< SUMX ect.

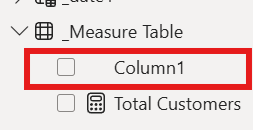
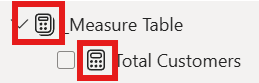
Step 4: Once the measure has been generated, delete 'column 1' from the table. The Measure Table icon should change to a calculator, making it easier to track all measures.
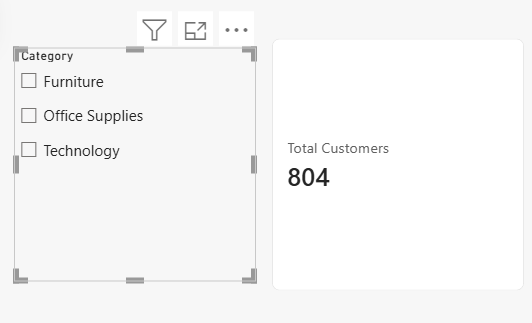
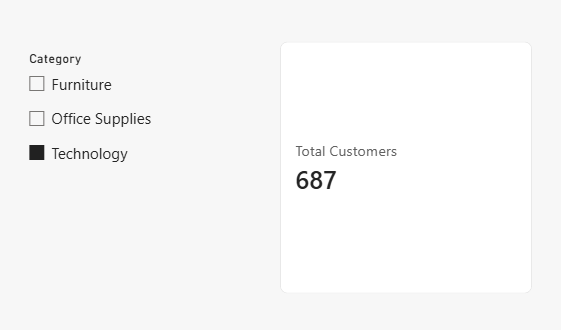
Step 5: The measure values can be checked using a card visualisation. This value changes with the filter context, an example is shown below.