


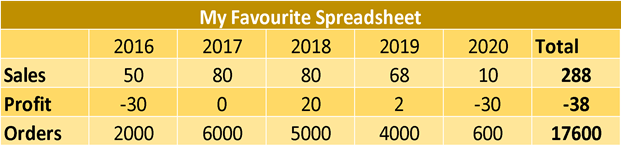
When you deal with data it might not necessarily come in the right format. Your data might come in a nice and wide format which is great for us humans to read and understand, but less so for machines.
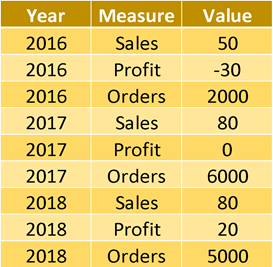
Or it might come in a very long format which makes it harder for us humans to read, even though a machine wouldn't have a problem reading it.
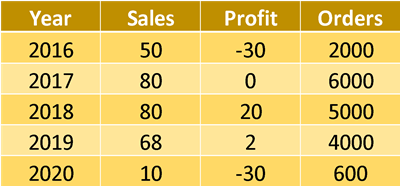
You probably want to get it into a nicely formatted way, which is usable for both humans and machines and makes aggregations within each of the fields easy.
But how do you do this in Alteryx. Say hello to our two pivoting tools Transpose and Cross Tab. These two tools let us:
- Reshape data to change its structure
- Redefine the row level of data structure
- Turn rows into columns or columns into rows
Transpose Tool
Alteryx describes the transpose tool as the tool that "moves values held in multiple horizontal columns into a single column." Meaning: it pivots fields into rows.
This is useful when we have a wide dataset, which we want to turn into a tall dataset.

In the example table below, we have a wide table showing sales data for each quarter per manager. We want to turn this into a long table with these fields: Manager, Quarter, Sales

Configuration
To configure the Transpose tool, we want to take a look at our data and understand the changes we want to make. We can then drag in the transpose tool and connect it to our last Alteryx step. This configuration window will pop up on the side of our screen:

It is split up into three parts: Key columns, Data columns, and Missing Columns
Key columns: In the key columns you define the columns you want to keep as they are. In our example this is the managers. They define our level of granularity. We want one row per manager.
Data columns: In the data columns you select the fields you want to pivot. The headers will become the values of the new Name field. Their values will be the values of the new Value field.
The last option ("Dynamic or Unknown Columns") lets you define what to do with new columns, if the data source was to be updated.
Missing Columns: Set this to "Warn" or "Ignore" to prevent the workflow from crashing if an expected column is missing, allowing you to see which one caused the issue.
Once we run this tool with the above settings (and use a select tool to rename our fields), this is our result:

Cross Tab Tool
Alteryx describes the cross tab tool as the tool that “creates 1 new column for each categorical value held in a single existing column, pivoting the data from a vertical layout to a more horizontal layout.” Meaning: it pivots rows into fields. This essentially creates several columns, depending on the number of different values in the “header” column.

In the example table below, we have a dataset, which is confusing to read, and it is hard to do calculations on each type of cost individually. Let's change that with the Cross Tab tool. We want one column per cost type with the cost as the value.

Configuration
To configure the Cross Tab tool, we also want to take a look at our data and understand the changes we want to make. We can then drag in the transpose tool and connect it to our last Alteryx step. This configuration window will pop up on the side of our screen:

It is split up into four parts: Group data by these values, Change Column Headers, Values for New Columns, and Method for Aggregating Values
Group data by these values: Here you define the columns you want to keep as the row level. In our example this is the store. This part defines our level of granularity. We want one row per store.
Change Column Headers: Here you select the field which you want to become the new column headers. In our case this is the Cost Type.
Values for New Columns: Here you select the field which you want to become the new column values. In our case this is the Cost.
Method for Aggregating Values: This step is mandatory and cannot be left empty. It is essentially giving the tool the information of what to do in case there are several values for each new row. In our case, it doesn't matter whether we choose Sum or Average, as we know that there is only one value per store and cost type. I have chosen Sum, as I would want to see the sum of costs if the dataset updated and we had several values per cost type and store.
Note: If you are pivoting string values, you will see other methods of aggregation (like concatenate).
Once we run this tool with the above settings, this is our result:
