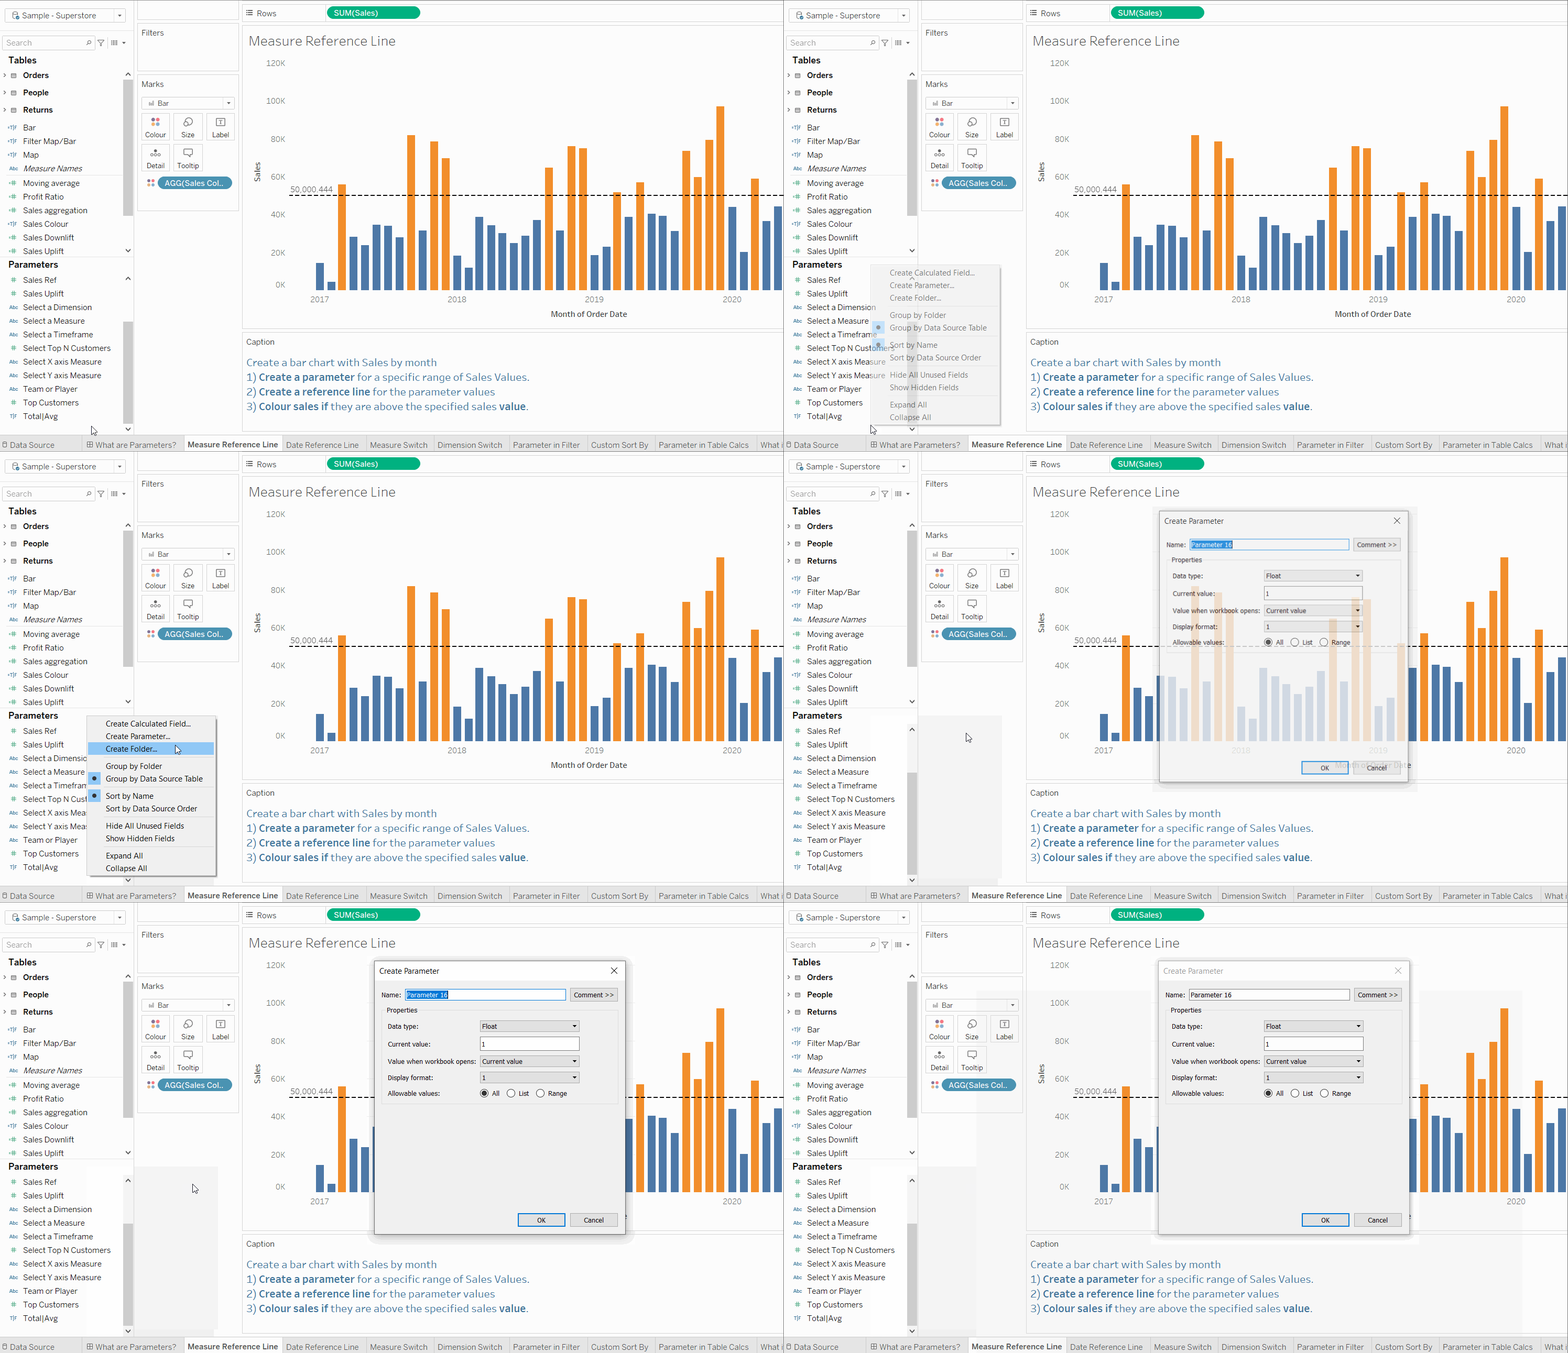
If you're looking to give your target audience the freedom to edit what happens within your worksheet or dashboard, then it's definitely worth considering the use of parameters! These are essentially user-defined variables, which will then alter what happens in your presentation. Examples of this can include adjusting a date range or adjusting the colour of data points to highlight certain thresholds. We'll be considering the latter for the purpose of this blog!

In order to start working with parameters, we first need to make one! We can do this by right clicking under parameters and selecting 'create', as shown in the GIF above.

As mentioned above, in this example the goal is to adjust a value range which will colour sales over a certain threshold. Much of the settings here are pretty intuitive and you can see here that our stakeholder can only move the sales value between 0.444 and 200,000, using intervals of 10,000.

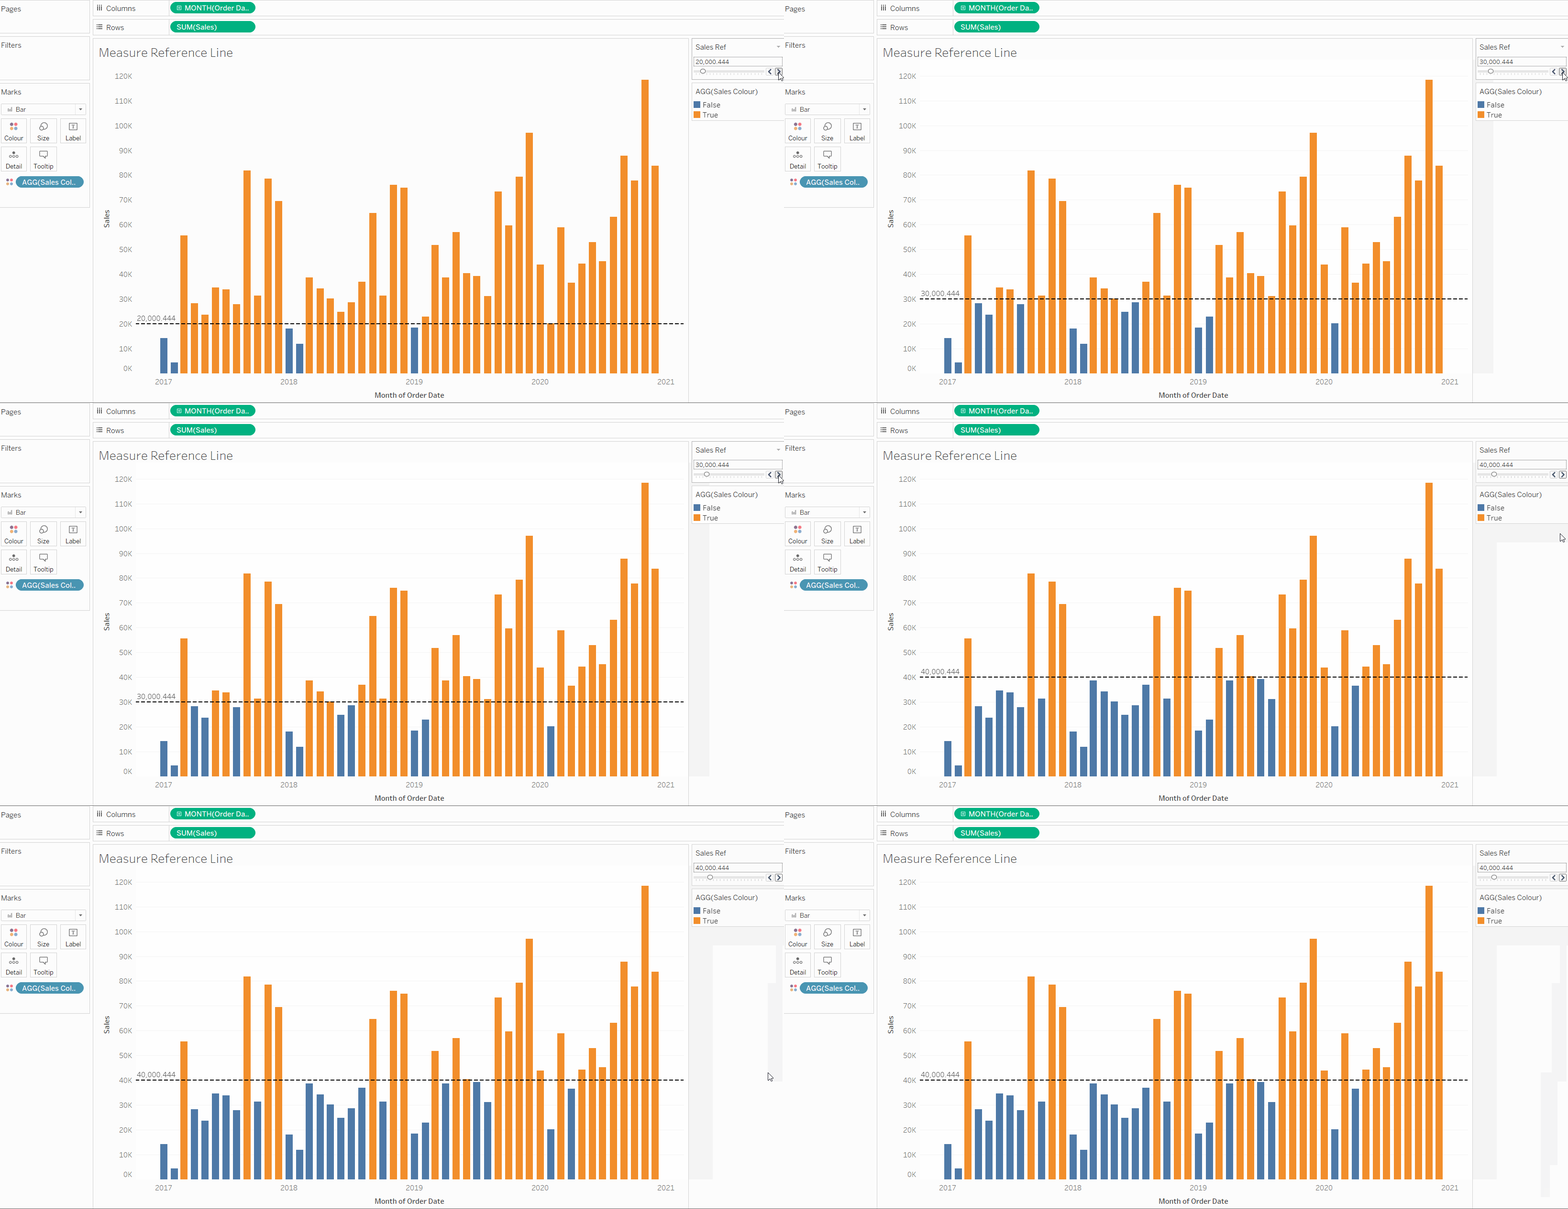
Now, obviously when it comes to highlighting, we need to set colours for our target measures. In this case we can use a very simple calculation as seen above, where we basically tell Tableau to identify any sales that are above what the user wants to look at (the value they have set the parameter to). The calculation above will lead to a Boolean outcome for each sales i.e. this figure is or isn't larger than our threshold and therefore we can simply add this to the colour shelf to demonstrate this visually. This is demonstrated clearly in the GIF below, where you can see the parameter being adjusted and the highlighting of sales moving with the conditions of our calculated field.

Now, as touched on above, there are several use cases for including parameters in your work. In an effort to keep this blog from becoming a novel, I've just decided to touch on a simple colouring example. However, if you're keen to look at more scenarios where they can come in handy then you can take a look through more blogs, or the TIL YouTube channel!
