Anyone who has used Tableau will know just how expansive the programme is in terms of how we can chop up and organise data. One key feature when deciding what to visualise, is the use of filters in order to focus in on certain chunks of our data at once. Here is a little explanation of some simple dimension filters that can have a big impact on your dashboard!

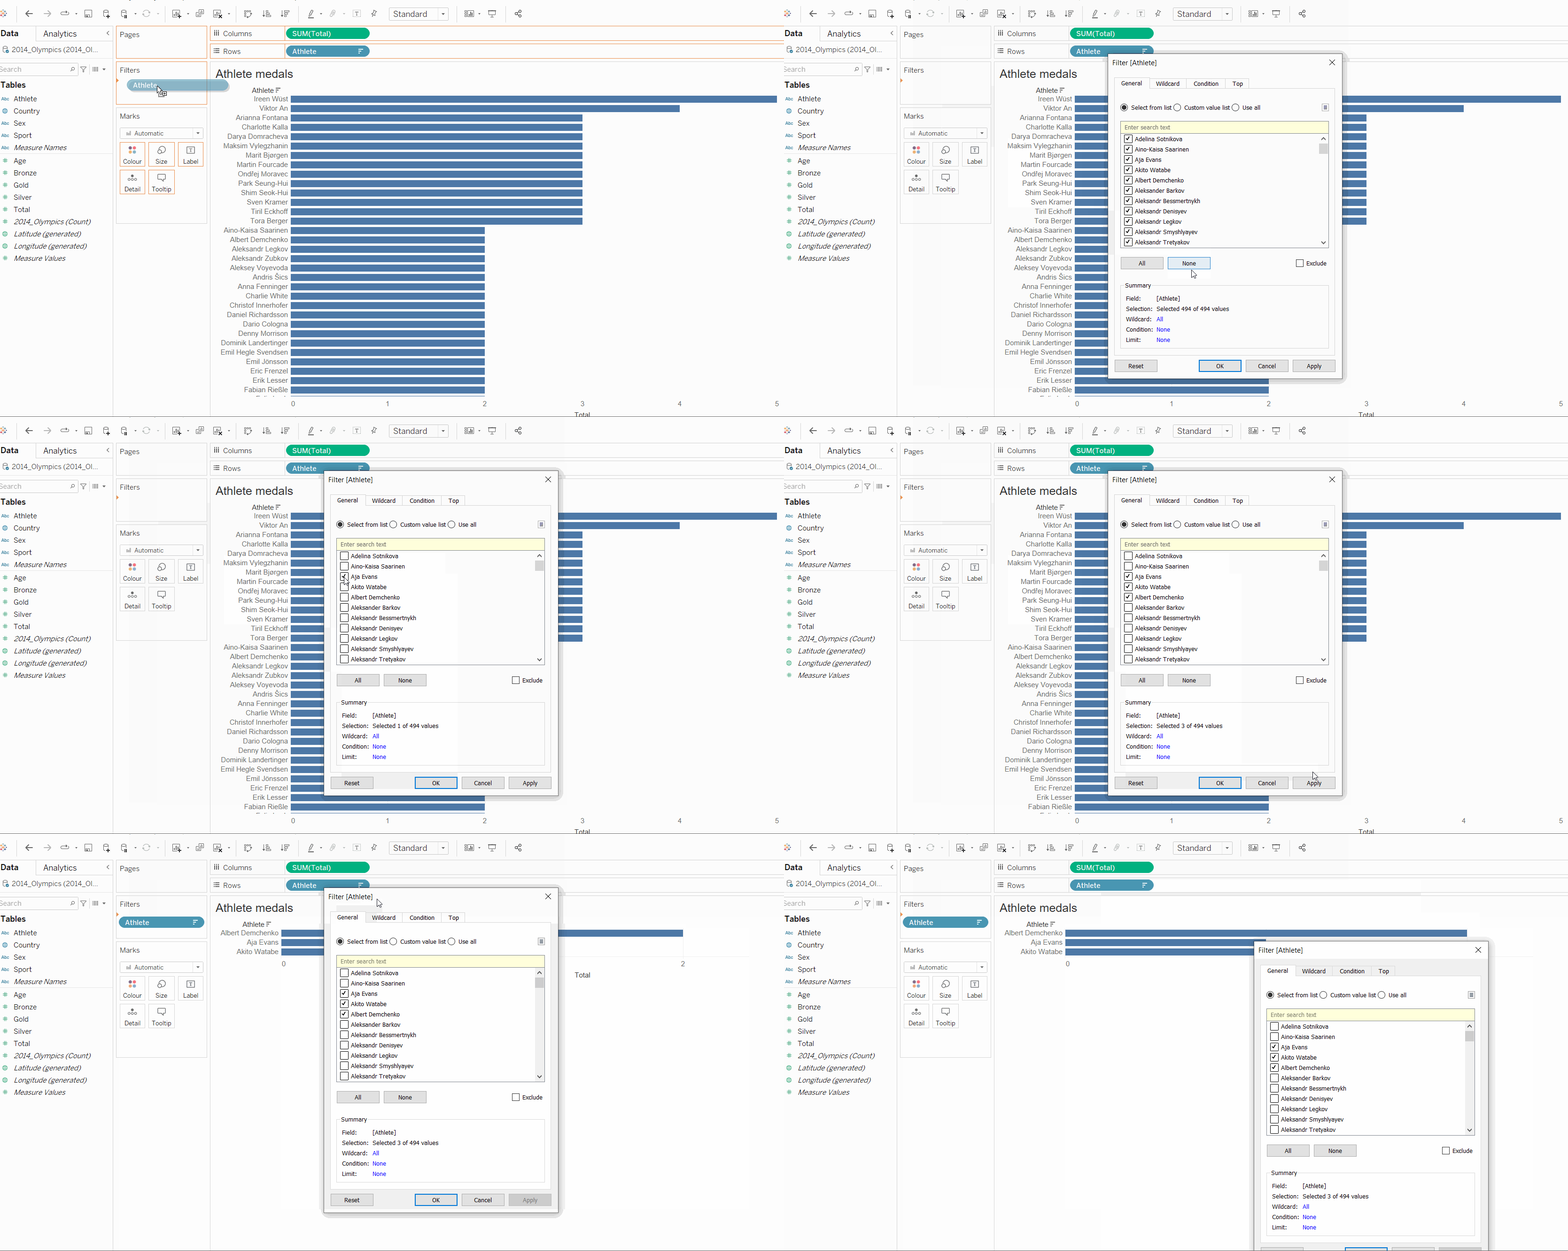
In today's example, we'll be filtering out athletes from the 2014 Olympic Games, based on how many medals they earned. The initial view (sorted ascending) is shown above. As you can see, it's a little messy and there's far too many individuals to look at - this would take up a huge amount of space on a final dashboard. So...
Option 1. Manual selection

This option is good if you know which rows in particular you would like to view. In this case, we can simply find the athletes of choice and only show their medal performance.
Option 2. Wildcard

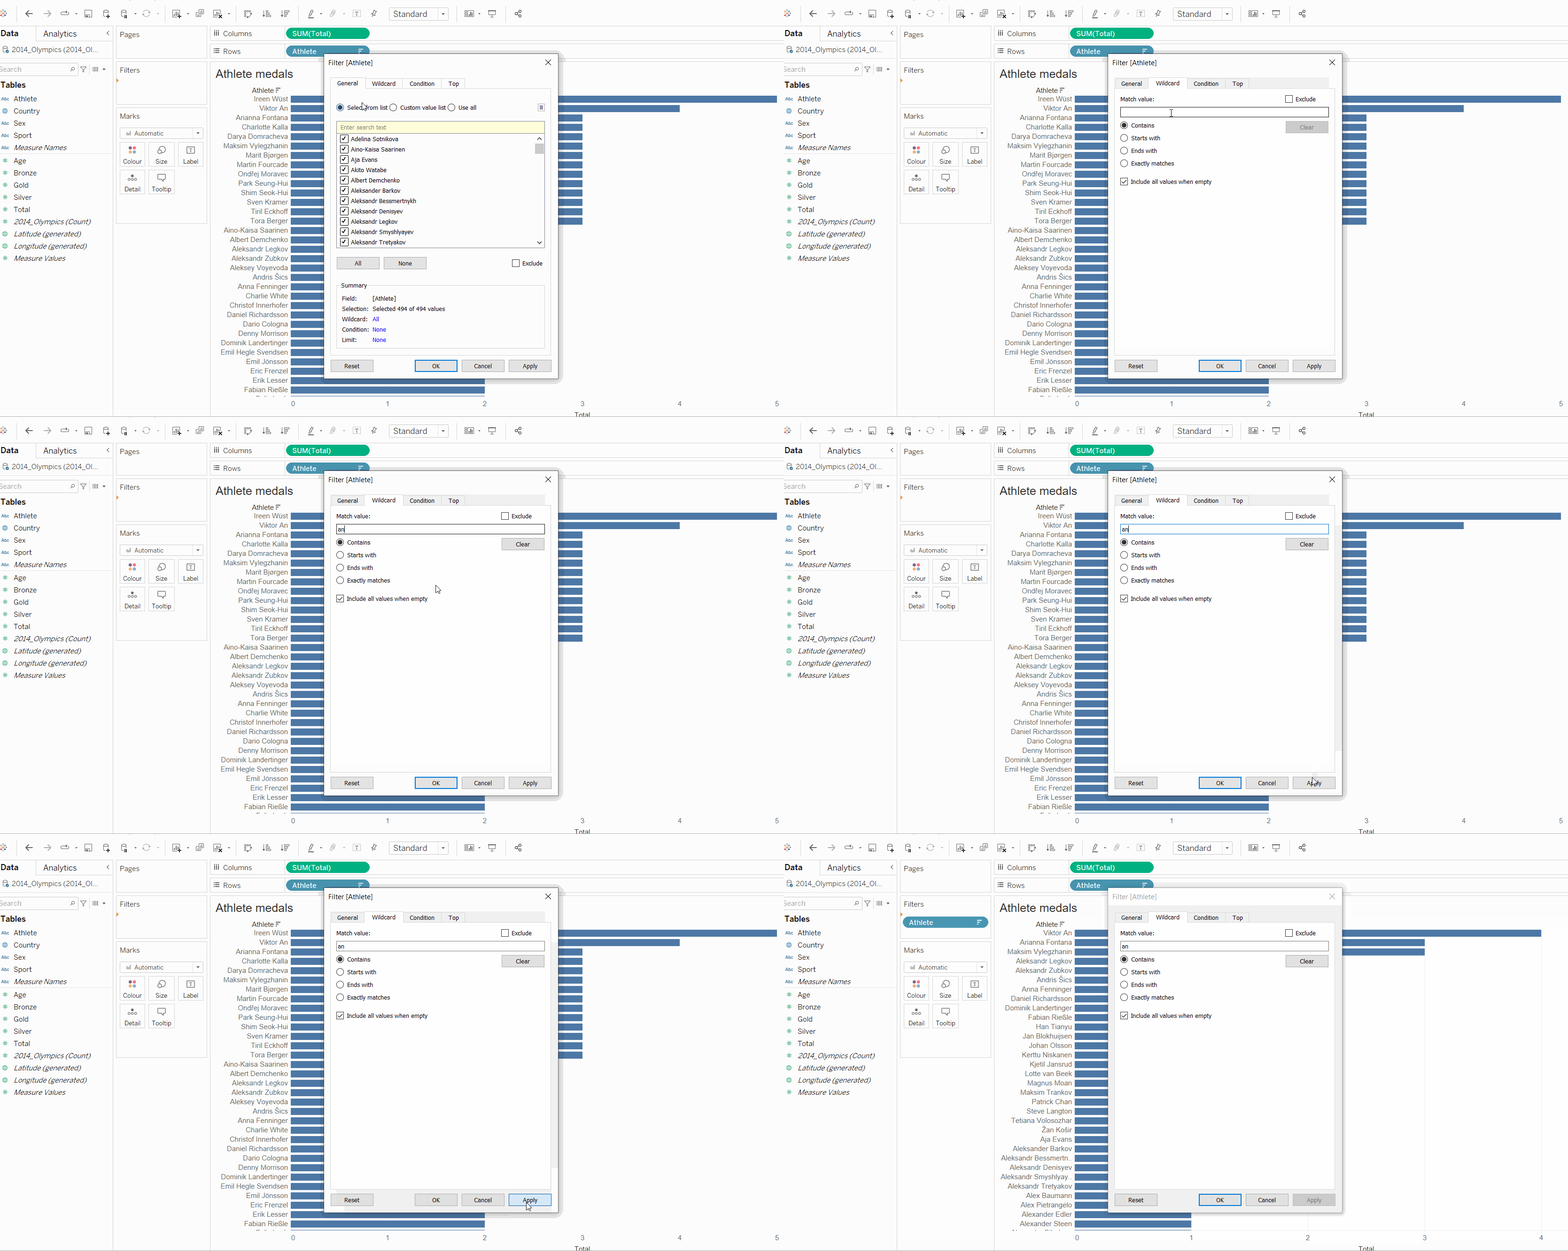
Whilst there are several options for using a wildcard, here I have opted to use the 'contains' function. As you can see in the GIF above, this filter leaves all individuals where 'an' appears somewhere within their name. Use of the wildcard is very valuable when looking at large data sets where you may want to view a group of items with a similar name. The other options are fairly self-explanatory i.e. 'starts with' would only show athletes whose name begins with 'an' and so on.
Option 3. Conditions

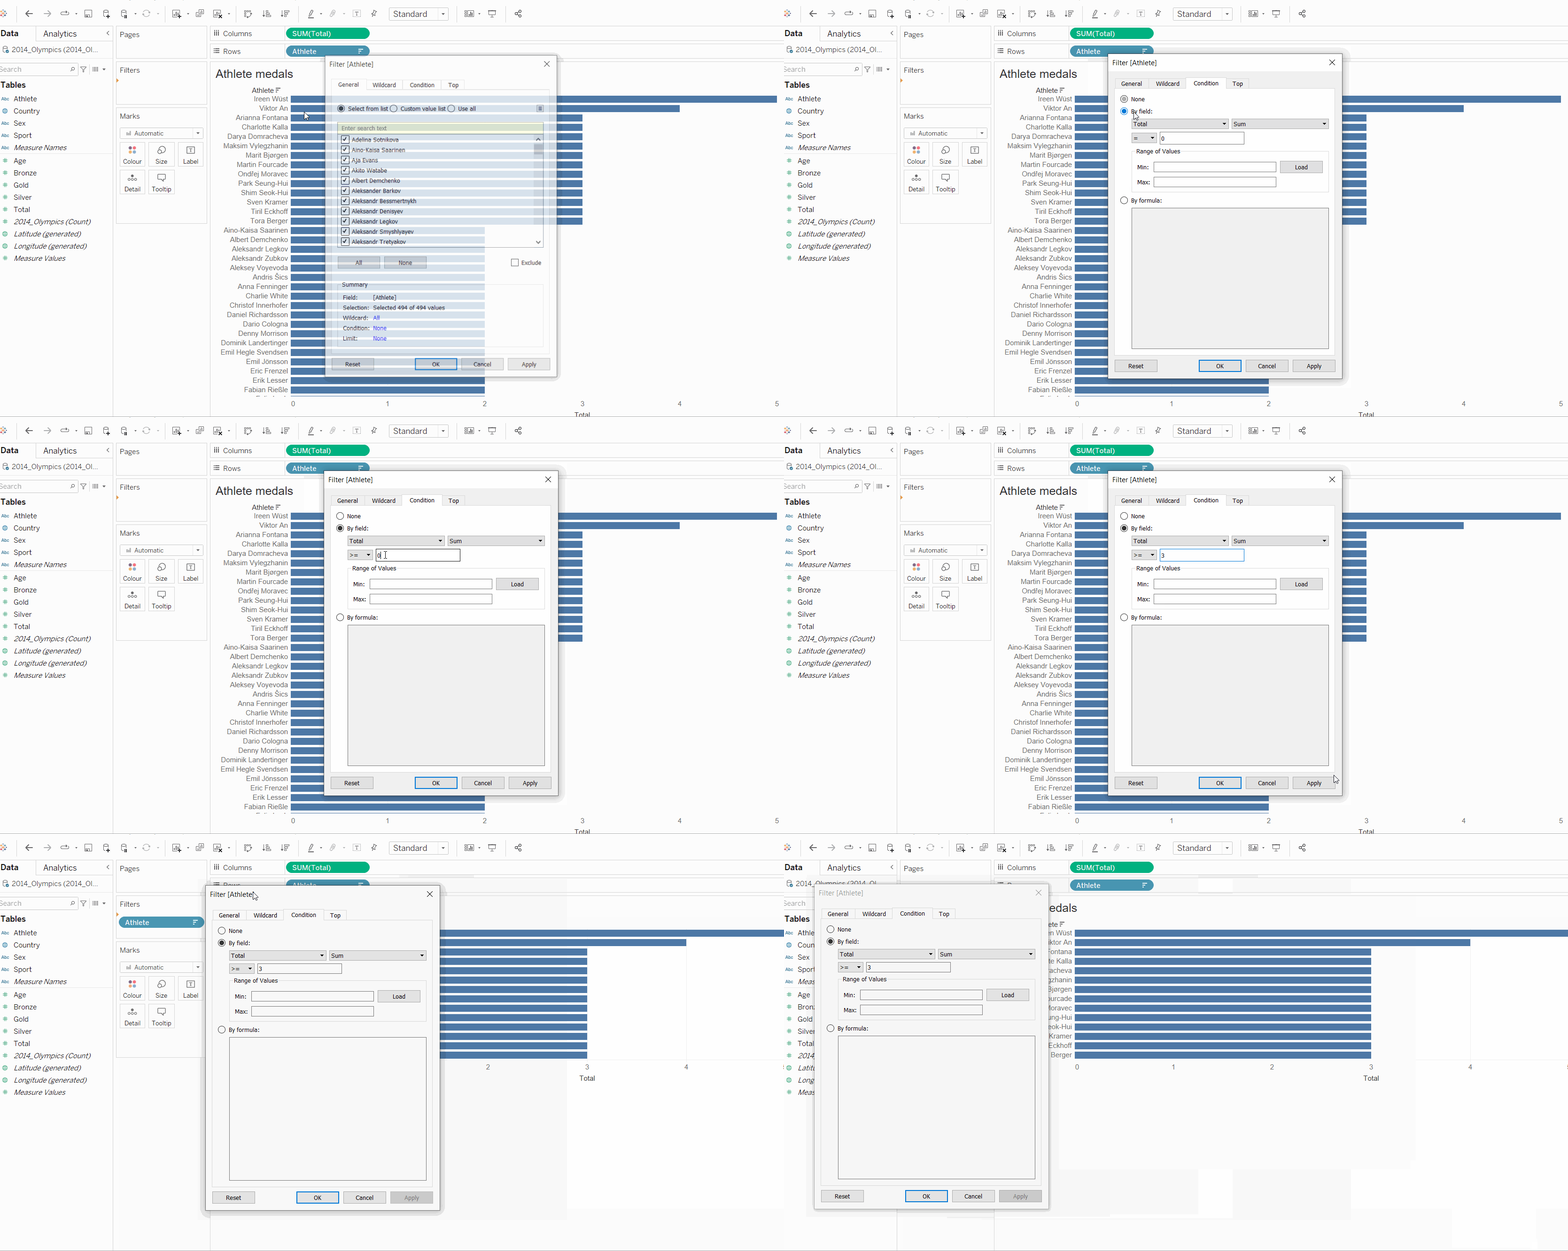
In the above example, you can see me filtering by a certain condition being met. I decided to filter by field (total is the total number of medals), where the number earned is equal to or greater than 3. Whilst we only have total medals shown on our bar chart, we could actually filter these by any field available within our data source; we would just need to select this from the dropdown instead of 'total'. Likewise, we can also apply different functions from the second dropdown menu i.e. average/min/max, rather than 'sum', and can finally change the condition (equal too, greater than, smaller than and such) in the third menu.
Option 4. Top N

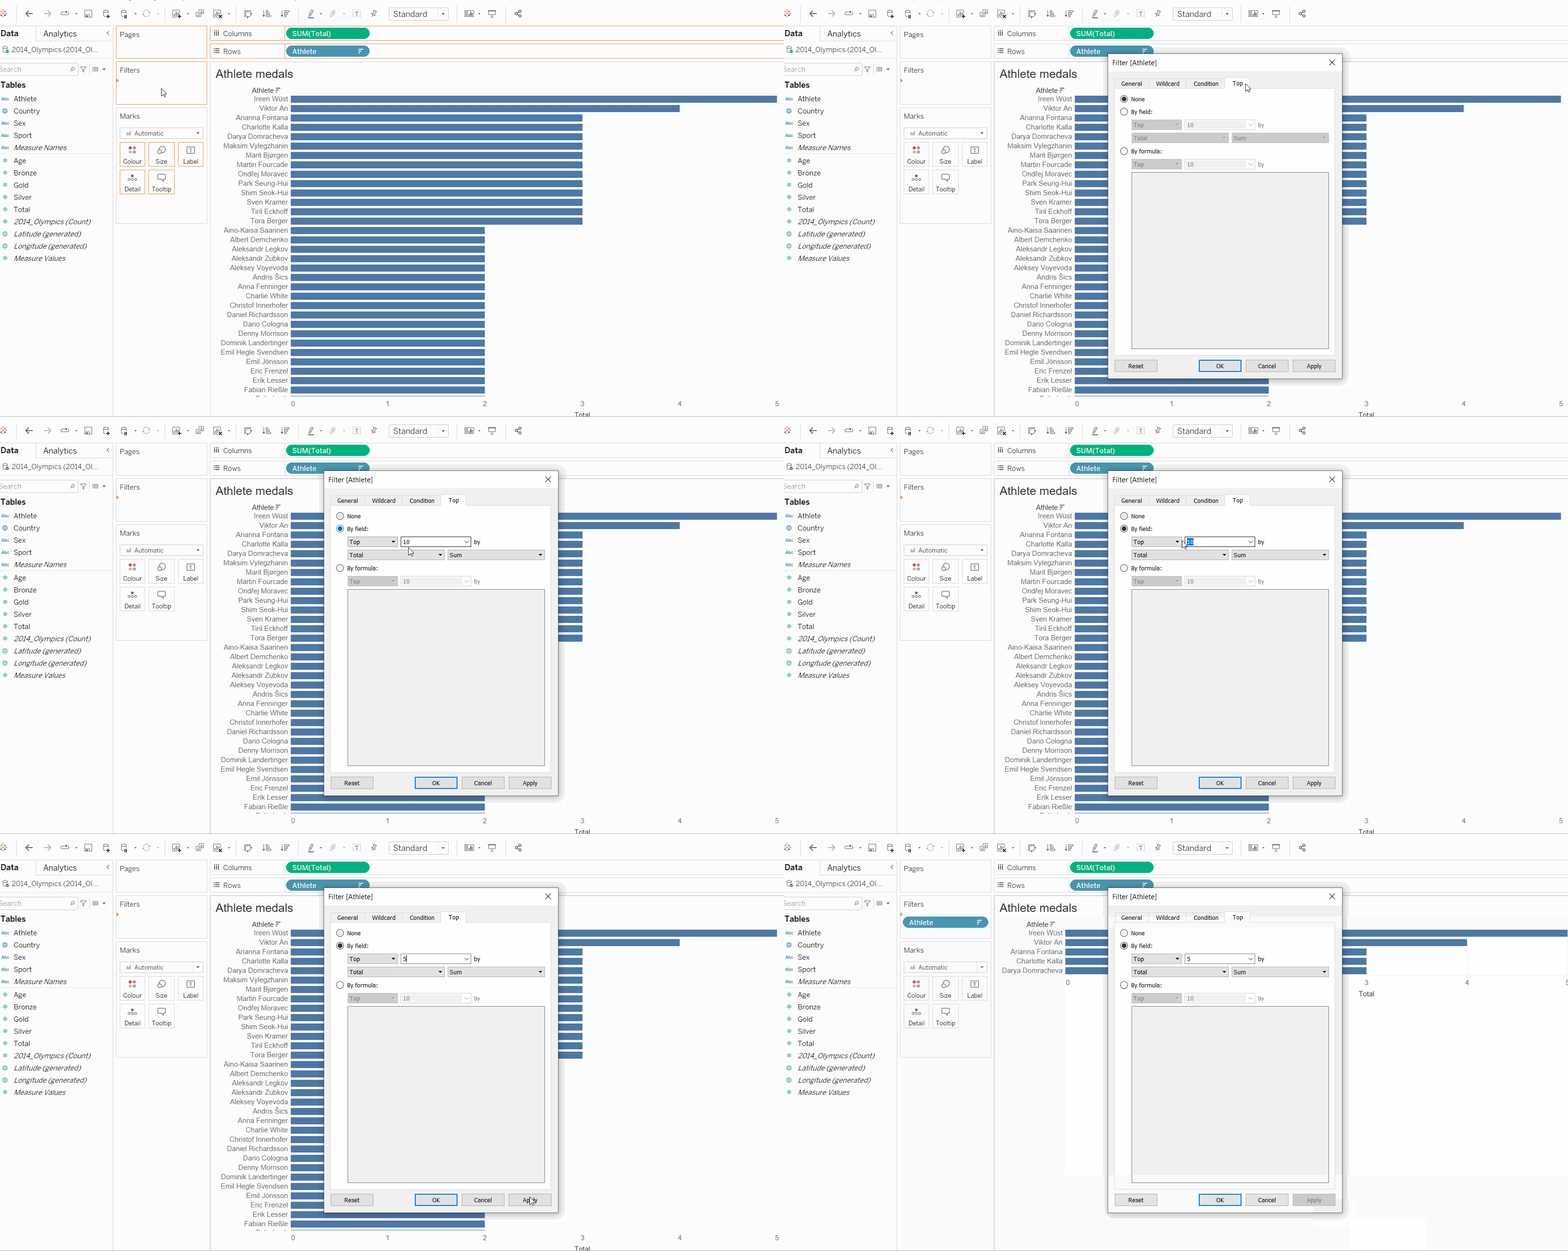
The 'Top N' filter does exactly what it says on the tin... this filters our data based on the top (or bottom) N performers within a certain field. As you can see above, I have decided to display only the top 5 medal scorers, based on their total medals earned. Much like option 3, we could also filter them based on different fields, such as their total number of silver medals if we selected 'silver' instead of total. Again, we can also change which mathematical function are applied, in case you wanted to filter based on averages/variance/standard deviation and the likes. Finally, as well as the 'top' N values, we can also select 'bottom' from the same dropdown and in this case, would see the bottom 5 athletes based on the same metric.
Filters are an incredibly useful tool and can really help us to dial in on certain aspects of a data source. This blog only scratches the surface of how we can apply these so make sure to keep an eye out for others! Resources such as the Data School blogs and YouTube channels like Andy Kriebel's are invaluable for tips like this!
