Welcome to Day 3 of Dashboard Week. If you've never been through one, the format is simple and slightly brutal: a new dataset every day, a dashboard built from scratch, and the clock always running. Today's dataset was a big one — and it turned into my favourite build of the week so far.
The brief handed me the MyAnimeList Dataset: a massive public scrape from MyAnimeList.net, the biggest anime-tracking site in the world. And the question I decided to chase with it in Power BI was one you'd normally just argue about with friends and never settle:
Do men and women actually watch anime differently?
The dataset
On MAL, users keep lists of every anime they've watched, mark each one as watching, completed, dropped, or plan to watch, and rate them 1–10. For a big chunk of users, the data also includes their gender, age, and location.
That last part is the whole reason today was interesting. Most datasets give you what got watched. This one puts who the viewer is right next to every single rating and every "dropped" flag. That's rare, and it's exactly what you need to compare two audiences.
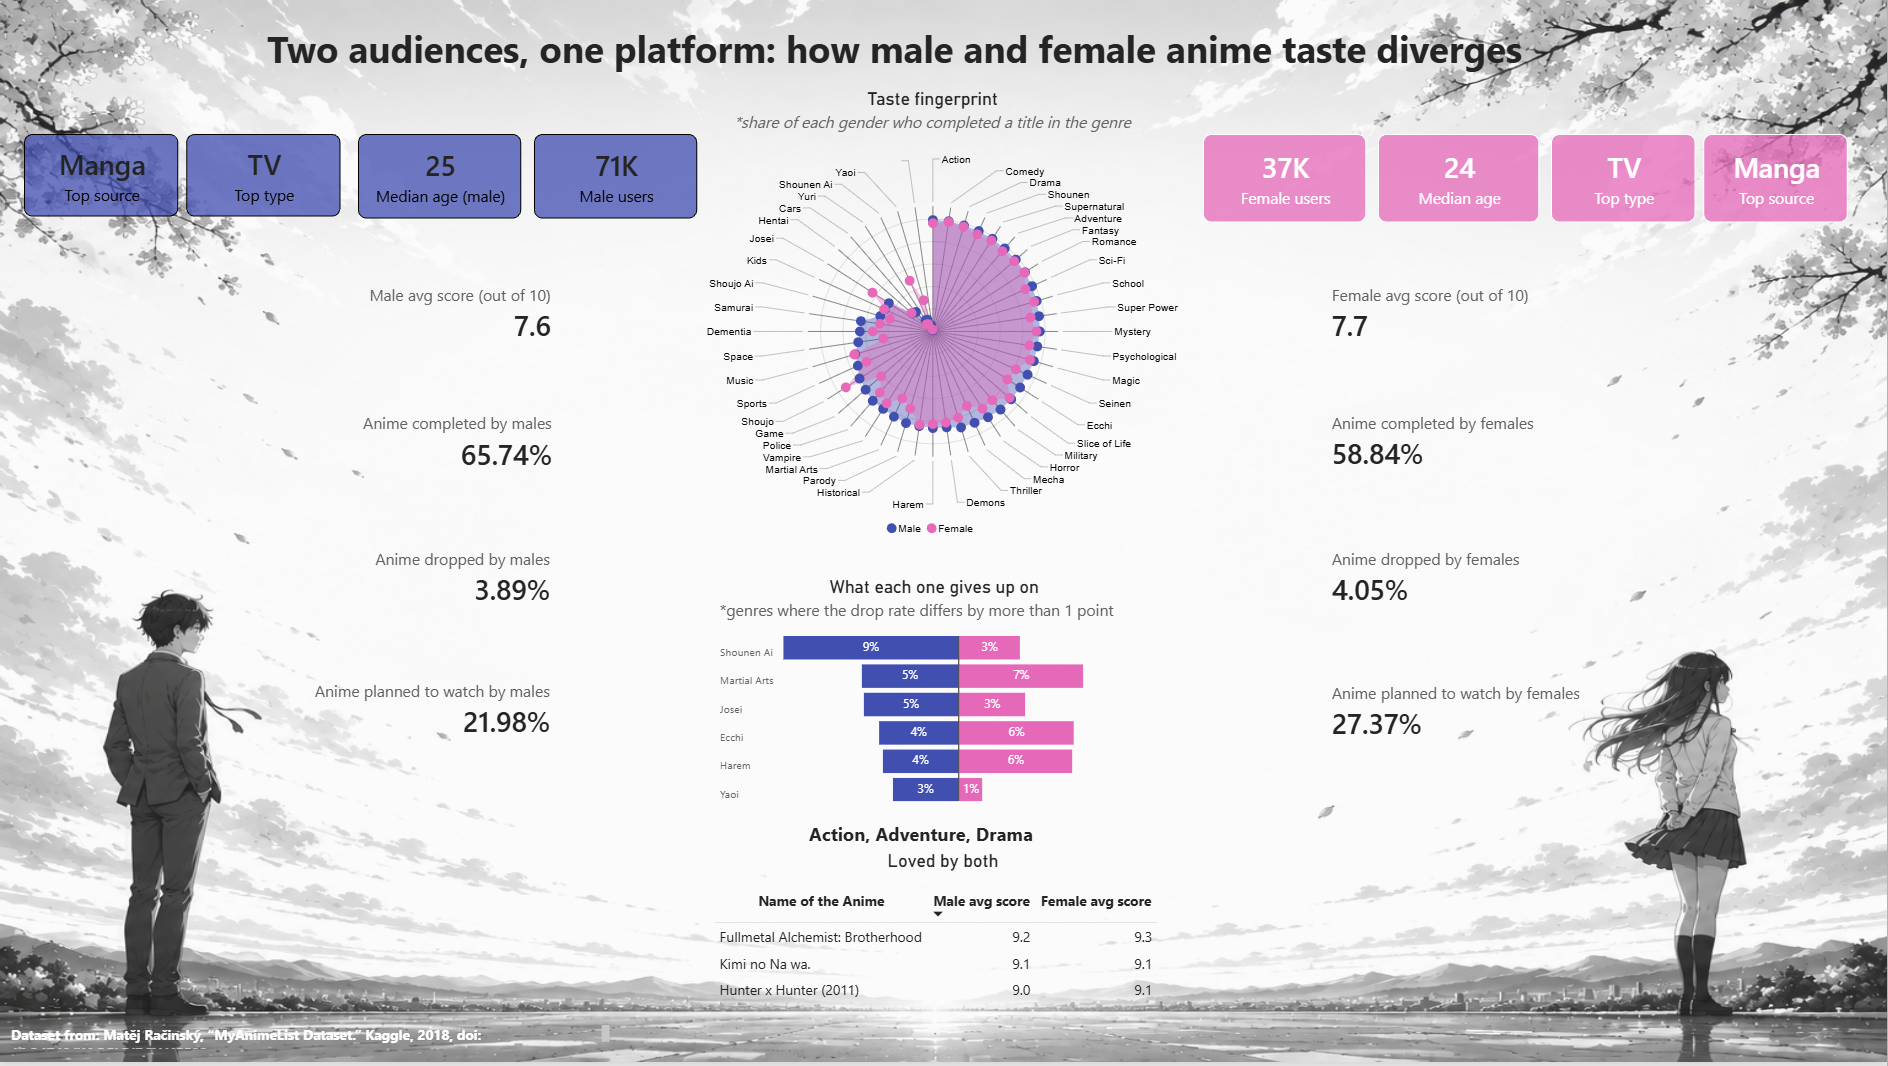
After cleaning it down to users with complete profiles, I had about 116,000 people — roughly 71,000 men and 37,000 women — and I built the whole thing in Power BI.
The data-prep grind (the honest bit)
No Dashboard Week post is complete without the part where the data fights back. A few things ate real time today:
- The genre field is comma-separated. One anime might be tagged "Action, Comedy, Isekai" all in a single cell, so before any genre analysis works you have to split it into one-genre-per-row. I lost a good while getting that to filter correctly through the model.
- Ratings use 0 to mean "not rated." Forget to filter those out and every average score gets dragged toward the floor. Easy to miss, annoying to spot after the fact.
- The location field is beautiful chaos — "home," "somewhere," "your mom's basement." I ended up not using it today and sticking to gender, which was clean.
- The fact table is enormous — tens of millions of list entries even after filtering — so anything sloppy in the model made the whole report crawl.
If you take one lesson from today: get the data model right first, because a broken relationship quietly makes every chart show the same number, and you'll waste an hour blaming your DAX.
The setup: mostly guys
First, a bit of context that shaped the whole story. Most anime fans on the site are men — about two in three.
That matters more than it sounds. When MAL shows a combined "top anime" ranking, men's votes outnumber women's two-to-one, so that ranking mostly reflects men's taste while looking like it represents everyone. The women's taste gets quietly drowned out. The only way to see it is to split the two groups apart — which is exactly what the dashboard does.
At first glance, they look the same
Here's the twist that made today fun: on the surface, men and women look almost identical.
They rate shows about the same — men average 7.6 out of 10, women 7.7. For both groups, the most-watched format is the TV series, and the most common source material is manga. If you stopped here, you'd shrug and call it a day.
But this is Dashboard Week, and shrugging isn't a deliverable. So I dug deeper.
Finishers vs. collectors
The first real difference isn't what they watch — it's how.
Men are finishers: they complete about 66% of what they start and drop under 4%. Women complete a bit less, around 59%, but they pile up far more "plan to watch" shows — 27% of their lists are waiting-for-later, versus 22% for men.
Think of a bookshelf. He reads his books one at a time, start to finish. She keeps buying more and building the stack. Same love of the hobby — different style.
The taste fingerprint
The centrepiece of the dashboard is what I called the taste fingerprint — a radar chart where each spoke is a genre, and the further each group's shape stretches, the more of them finished it.
The two shapes lean in opposite directions. Men reach toward action, mecha (giant-robot shows), and ecchi (racy comedy). Women reach toward romance, drama, and stories rooted in girls' and women's manga.
A couple of those genre names are worth translating, because they are the story:
- Shoujo — made for teenage girls. Romance, school life, first crushes.
- Josei — the grown-up version: "ladies' manga," for adult women, with more mature relationships.
- Shounen — the equivalent for teenage boys: the big action-adventure category.
So when women lean toward shoujo and josei and men toward shounen, each group is really drawn to the material written for them in the first place.
The most interesting signal: what they quit
My favourite chart of the day flipped the question. Instead of what each group watches, I looked at what they give up on — because dropping a show is a stronger signal than a low score. They actually walked away.
A few genres split the two clearly: women quit the racy, fan-service-heavy shows more; men quit the girly-romance shows more. The biggest gap is boys'-love romance, which men drop about three times as often as women.
And here's the honest caveat — the one I made sure to put right on the chart: these are tiny genres. Fewer than 200 dropped titles in each, so it's a real but niche pattern, not a sweeping rule. In all the big mainstream genres, both groups drop shows at pretty much the same rate. Saying that out loud makes the finding more trustworthy, not less — and on a fast build, resisting the urge to oversell a spicy result is half the job.
Where they meet in the middle
After all the divergence, the warm ending: men and women have a lot in common.
They share whole genres — comedy, adventure, and fantasy are loved right across the board, no gender divide at all. And they share plenty of favourite shows. There's a long list of anime both groups finished and both rated near-perfect; a few from the very top: Fullmetal Alchemist: Brotherhood, Your Name, and Hunter x Hunter, all pulling 9s from both sides.
I built the layout around this idea deliberately — two figures facing each other, with the "loved by both" list sitting in the middle, right where they're both looking.
The takeaway
One line to sum up Day 3:
Men and women each drift toward the stuff made for them — but they share the same favourite genres and a whole pile of shows they both love.
Link to a dashboard:
https://app.powerbi.com/groups/me/reports/aee50e2a-f5d9-4377-a4ca-a1e1c4989b2e/3bafa7239a442bdd178b?experience=power-bi
Onward to Day 4. But of the week so far, this is the one I'd actually show someone at a party.