


Like it is normal in any kind of training periods, the first few weeks as a Data School Consultant by The Data School Germany were filled with lots of information that helped me have a basic understanding of Data and the tools I will be using. One of the first tools that we used and where we got to practice what we learned was Power BI Desktop.
This article is going to be part of a Power BI Series, so if you are interested to learn more about this really powerful tool, I suggest you keep an eye on my blogs. 😉
Now, before I start writting about Power BI Desktop, I will say a few words about the Power BI Environment, as Power BI Desktop is just the center piece that is tied to all other Microsoft Services related to Data Analytics and Data Visualisation.
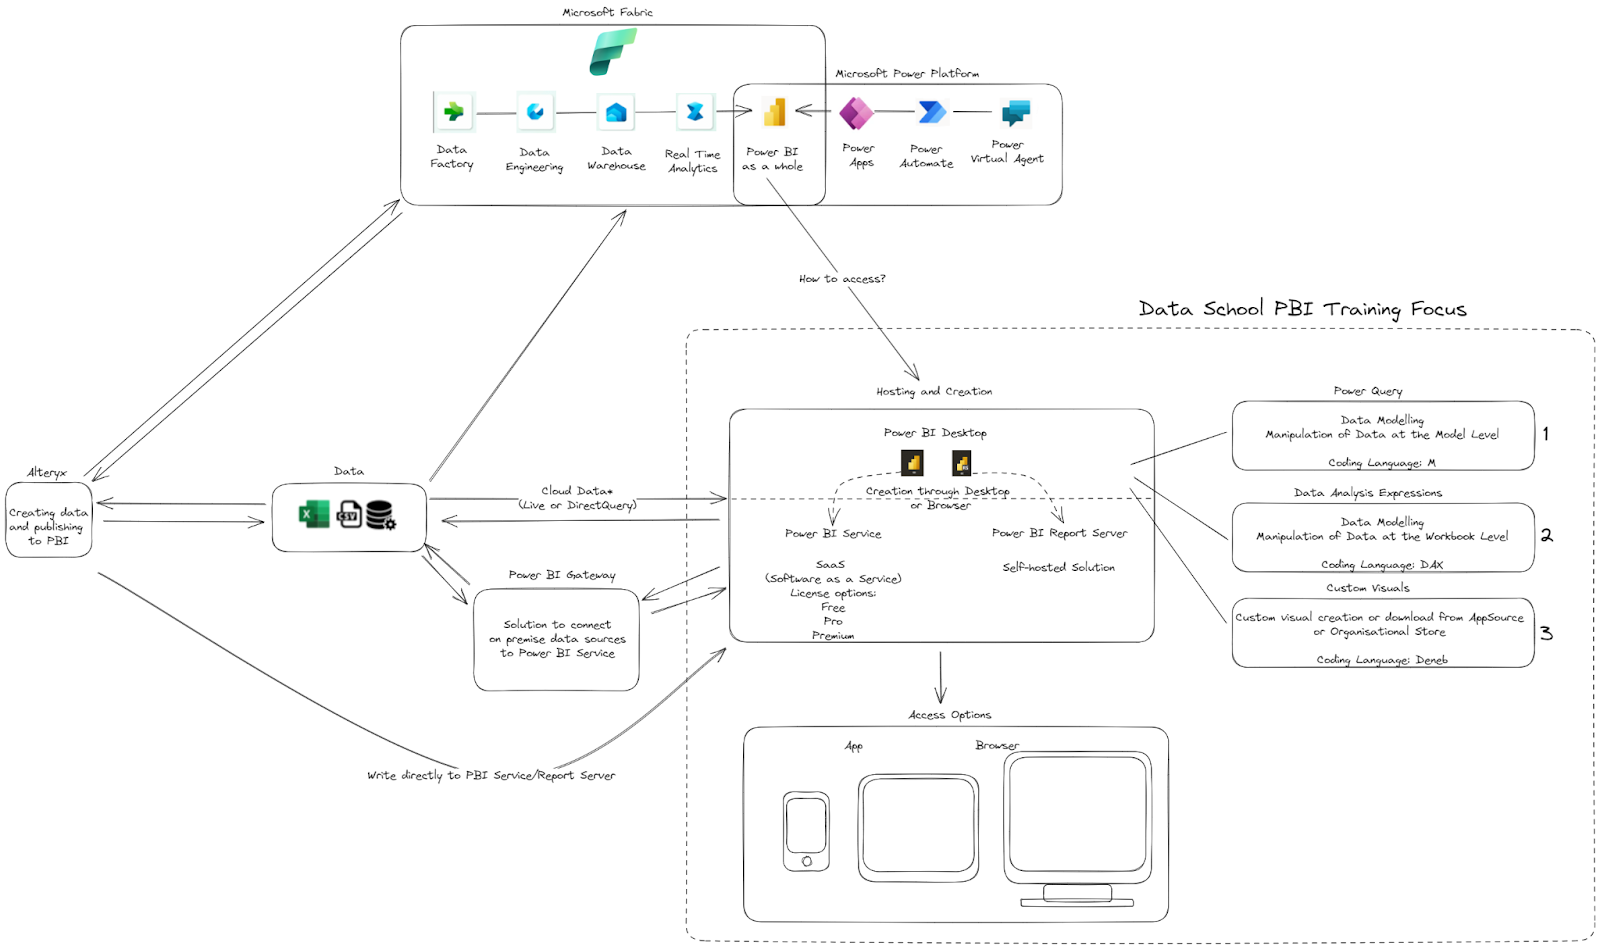
The Power BI Ecosystem is divided mainly into 2 areas. Microsoft Fabric, which was launched in May 2023, it is an independent data platform that contains a lot of backend capabilities and include apps like Data Factory, Data Engineering, Data Warehouse Real Time Analytics and like I said, the center piece of the Power BI Ecosystem, Power BI Desktop.
While Microsoft Fabric is used for its backend opportunities, Microsoft Power Platform, which was launched in 2018 includes tools that can be used on top of the data, like Power Virtual Agent, Power Automate, Power Apps and yes, you guessed it, Power BI Desktop. 🙌
So overall, the Power BI ecosystem consists of several interconnected components aimed at enabling data analysis, visualization, and sharing insights across organizations. Some of the more important components are:
- Power BI Service is a cloud-based component that allows organisations to publish their reports once they are created in Power BI Desktop. This cloud-based platform allows for collaboration, sharing, and management of reports and dashboards. It offers features such as scheduled data refresh, sharing reports with specific users or groups, creating and managing workspaces, and embedding reports into websites or applications.
- Power BI Report Server is an on-premises reporting solution which allows organizations to host Power BI reports on their own servers, providing more control over data and reports, especially for businesses with stringent data security and compliance requirements that prefer on-premises solutions.
- Power BI Gateway facilitates secure data transfer between on-premises data sources and the Power BI Service. It allows for scheduled data refreshes and live connections to data sources behind corporate firewalls.
- Power BI Mobile enables users to access and interact with reports and dashboards from smartphones or tablets. It provides a responsive and optimized viewing experience, allowing users to stay connected and make data-driven decisions on the go.
- Power BI Integrations allowsPower BI Desktop to integrate with other Microsoft products such as Excel, Azure services (Azure SQL Database, Azure Data Lake Storage, etc.), Dynamics 365, Teams, SharePoint, and more. These integrations allow users to leverage existing data sources and work within familiar environments, enhancing productivity and collaboration.
Let's just take a more detailed look of Power BI Service and Power BI Report Service, because it is extremely important to understand the pros and cons of each option before deciding how to host and publish your reports created in Power BI Desktop.
Power BI Service is the go-to option if you or your organisation prefer the cloud-based convenience that comes from being able to access your reports from any location with internet access, as there is no need for on-premises infrastructure setup or maintenance.
Also, it is worth mentioning that Microsoft manages updates and improvements, ensuring users have access to the latest features and functionalities without manual updates.
Power BI Service scales easily to accommodate growing data needsand it offers a wide array of data connectors and integrations.
On the other hand, it might not be suitable for organizations with strict data sovereignty requirements or regulatory limitations on cloud-based storage. While highly user-friendly, it might lack the depth of customization and extension capabilities compared to on-premises solutions.
Power BI Report Server offers complete control over data and infrastructure, ideal for organizations with strict data security and compliance needs.
It also provides more customization options, supports paginated reports, and allows integration with custom applications or extensions and it works even without internet access once reports are published to the local server.
On the other hand, it requires dedicated on-premises infrastructure, leading to higher initial setup and ongoing maintenance costs.
Then don't forget that updates and new features need manual implementation, potentially causing delays in accessing the latest functionalities.
Scalability might be constrained by the organization's own infrastructure limitations compared to the vast cloud-based resources available in Power BI Service.
Choosing between Power BI Service and Power BI Report Server often depends on your or your organization's specific requirements regarding data control, compliance, scalability, and infrastructure preferences. Many organizations adopt a hybrid approach, leveraging the strengths of both solutions based on their use cases and needs.
In the next chapter of this Power BI series, we will dive into the first concepts needed to master Power BI Desktop and its tool for Data Preparation, Power Query. If this article made you interested in finding out more about Power BI, then make sure not to miss out the next article.