


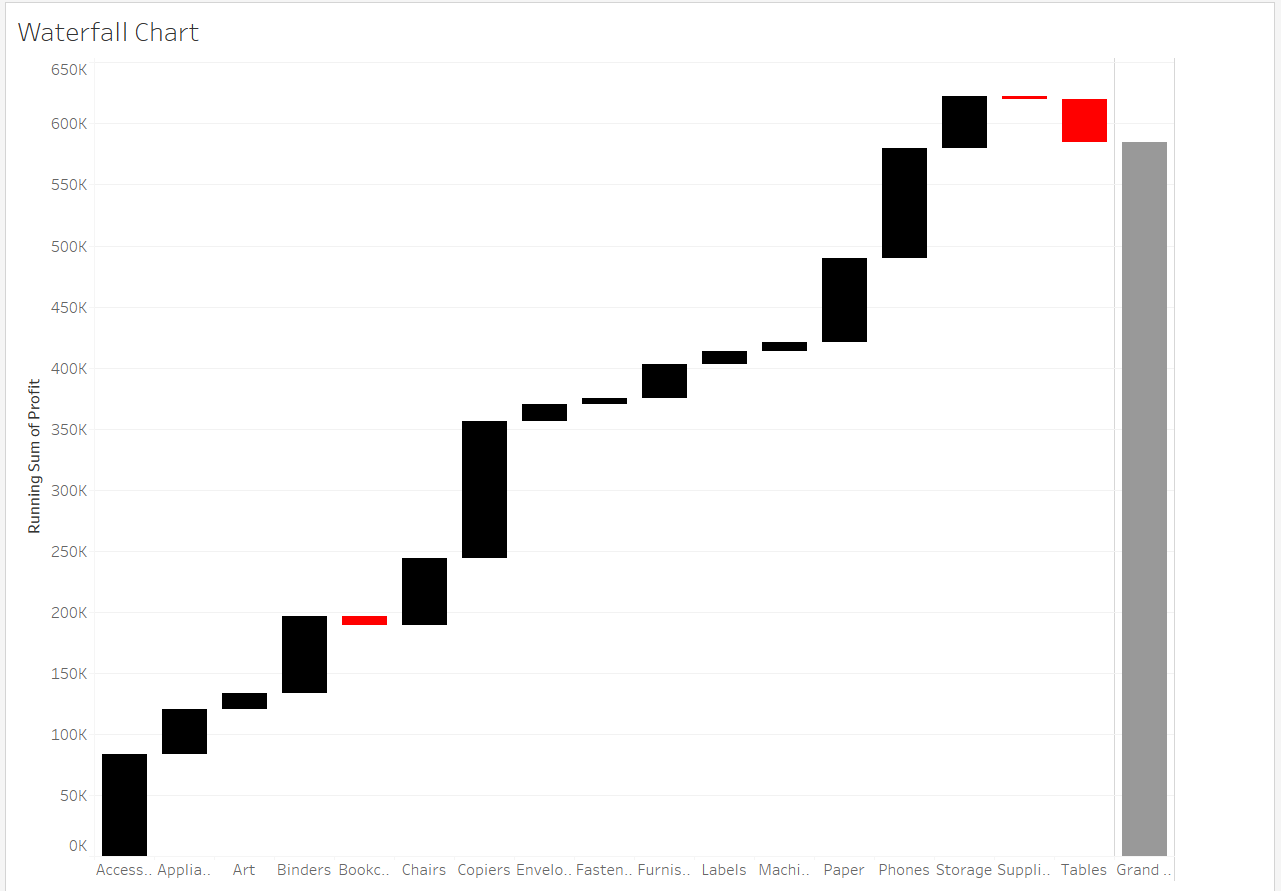
A waterfall chart is a great way to illustrate parts of a whole over time or across categories. In the example above, the waterfall chart displays the profit for each category and demonstrates how each category contributes to the total profit for the entire store. From this chart, it is evident that Accessories, Copiers, and Phones were significant contributors to profit, while those highlighted in red had negative profits. Using a waterfall chart in this manner proves to be an effective visualization tool, and creating one is simpler than you might think.
Place Your Pills
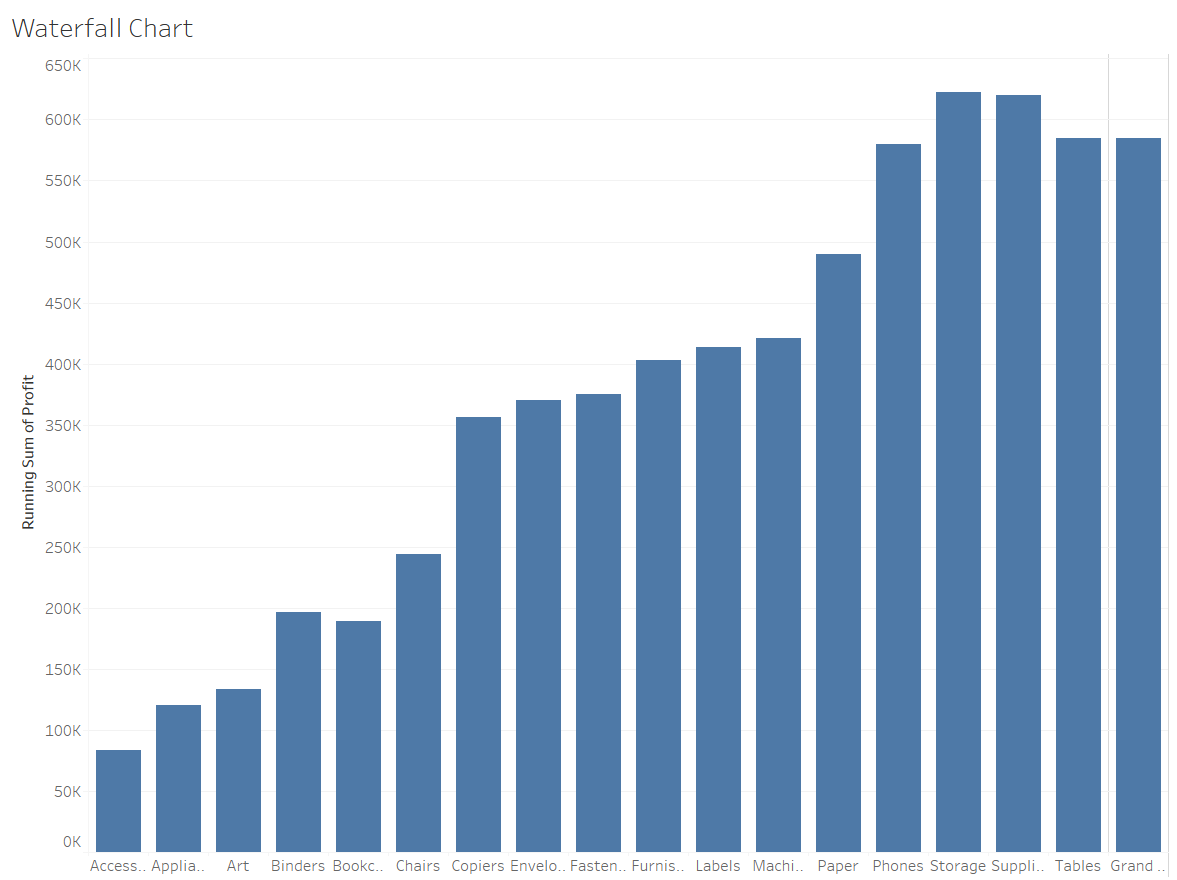
Begin by placing categories into columns and profit into rows. This arrangement will generate a bar chart illustrating the profit for each category.
Table Calculation
The next step involves clicking on the profit pill in rows, then selecting "Add Table Calculation." This action opens a menu with various table calculations such as difference from, percent of total, and rank. The chosen calculation is the running sum, computed with a sum. The use of the running sum is crucial because the waterfall chart's objective is to identify parts of a whole, and calculating the running sum of all categories helps achieve this goal. Executing this step correctly results in a bar chart where each category's bar progressively increases as the visualization moves towards the right (unless negative values are present). The visual should resemble the following:
Once you achieve a view like this, switch the mark from bar to Gantt bar in the marks card on the left of the chart. This adjustment will reduce each bar to the top portion of the original bar.
Now, the goal is to make the bars touch the floor.
Calculated Fields
If you were to drag profit to size, you would notice that each bar extends upwards (or downwards if negative) in the wrong direction. Tableau does this because, since the number is positive, it makes the bar extend more positively. To address this, create a calculated field and input (-[Profit]). This adjustment ensures that each bar extends in the desired direction, resulting in the final product.
If you wish to incorporate color for negative values, create another calculated field that states [Profit]>=0 and drag it into the color section on the marks card.
If you want to add the grand total to your chart, navigate to the analysis tab at the top of the screen, go to totals, and select "Show Row Grand Totals."
With these steps, you should achieve the final product.