


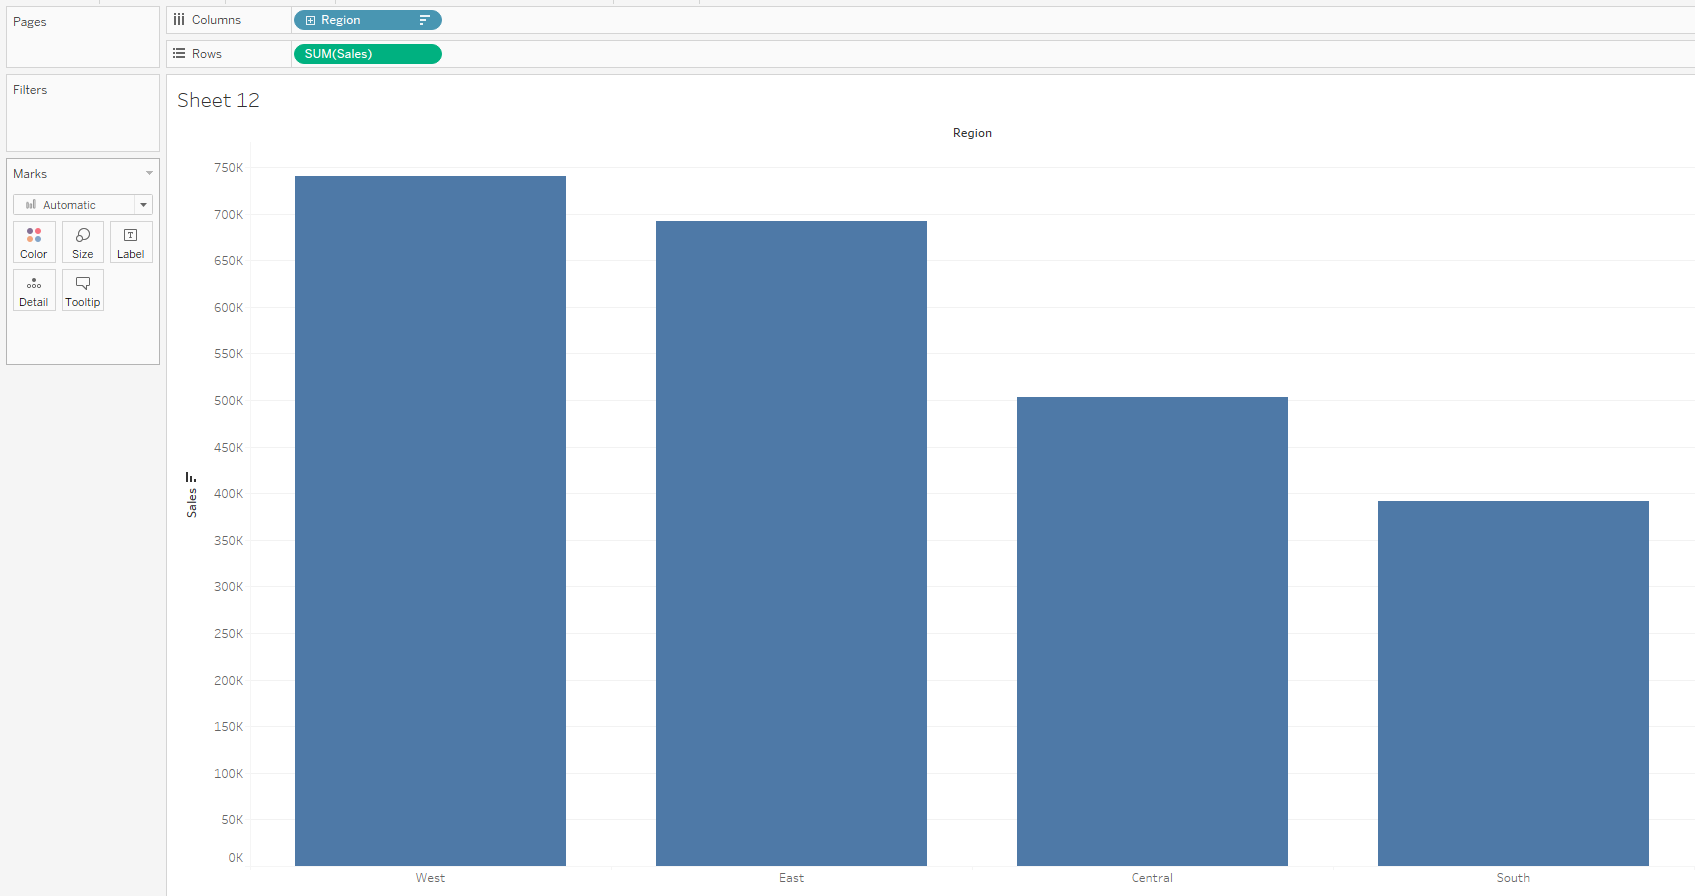
In todays blog, I shall take you through how to create a waterfall chart. Using superstore, we can create a waterfall chart to show the region with most sales, running total of sales and in some aspects calculate the difference in yearly regional sales.
- Put sales and region in rows and column shelf respectively and sort descending.
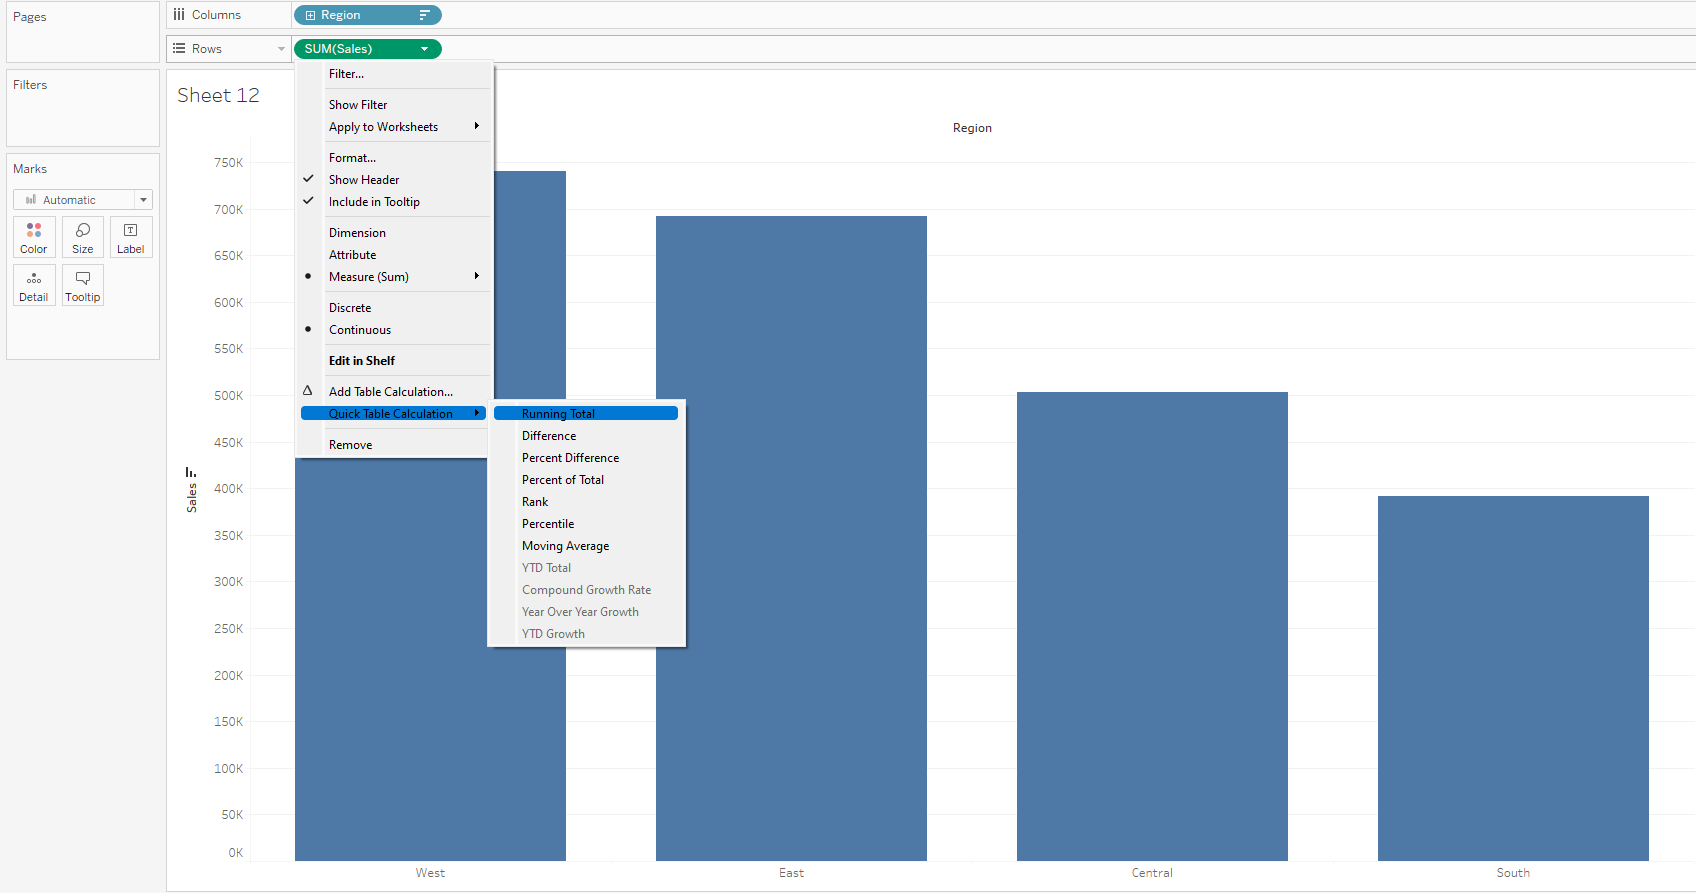
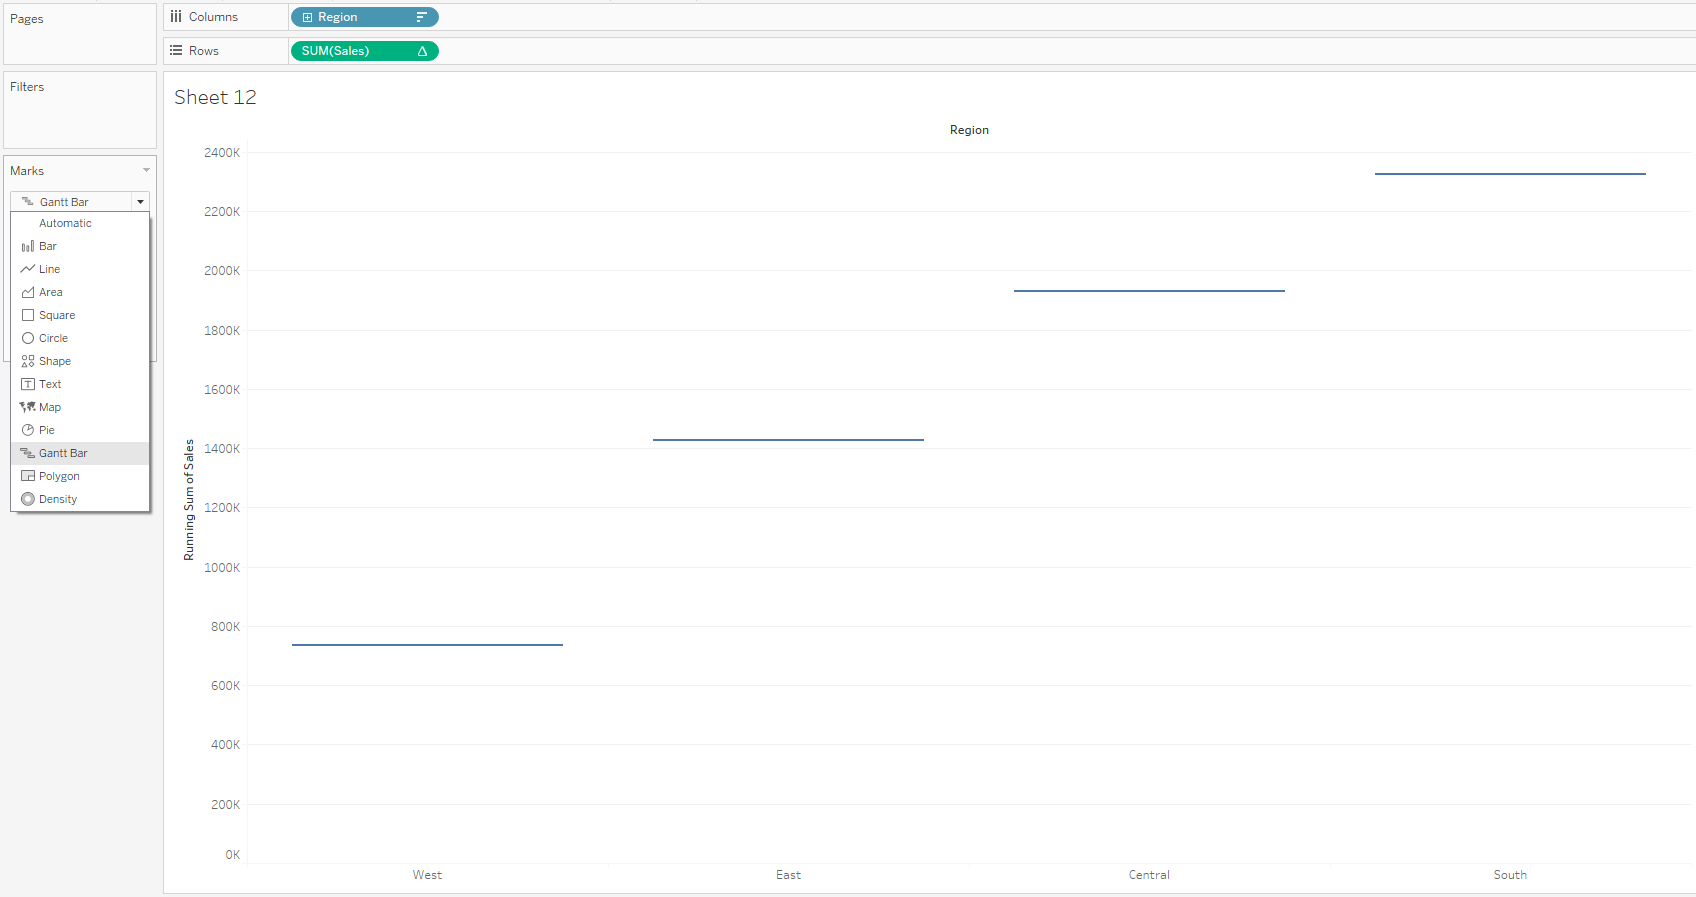
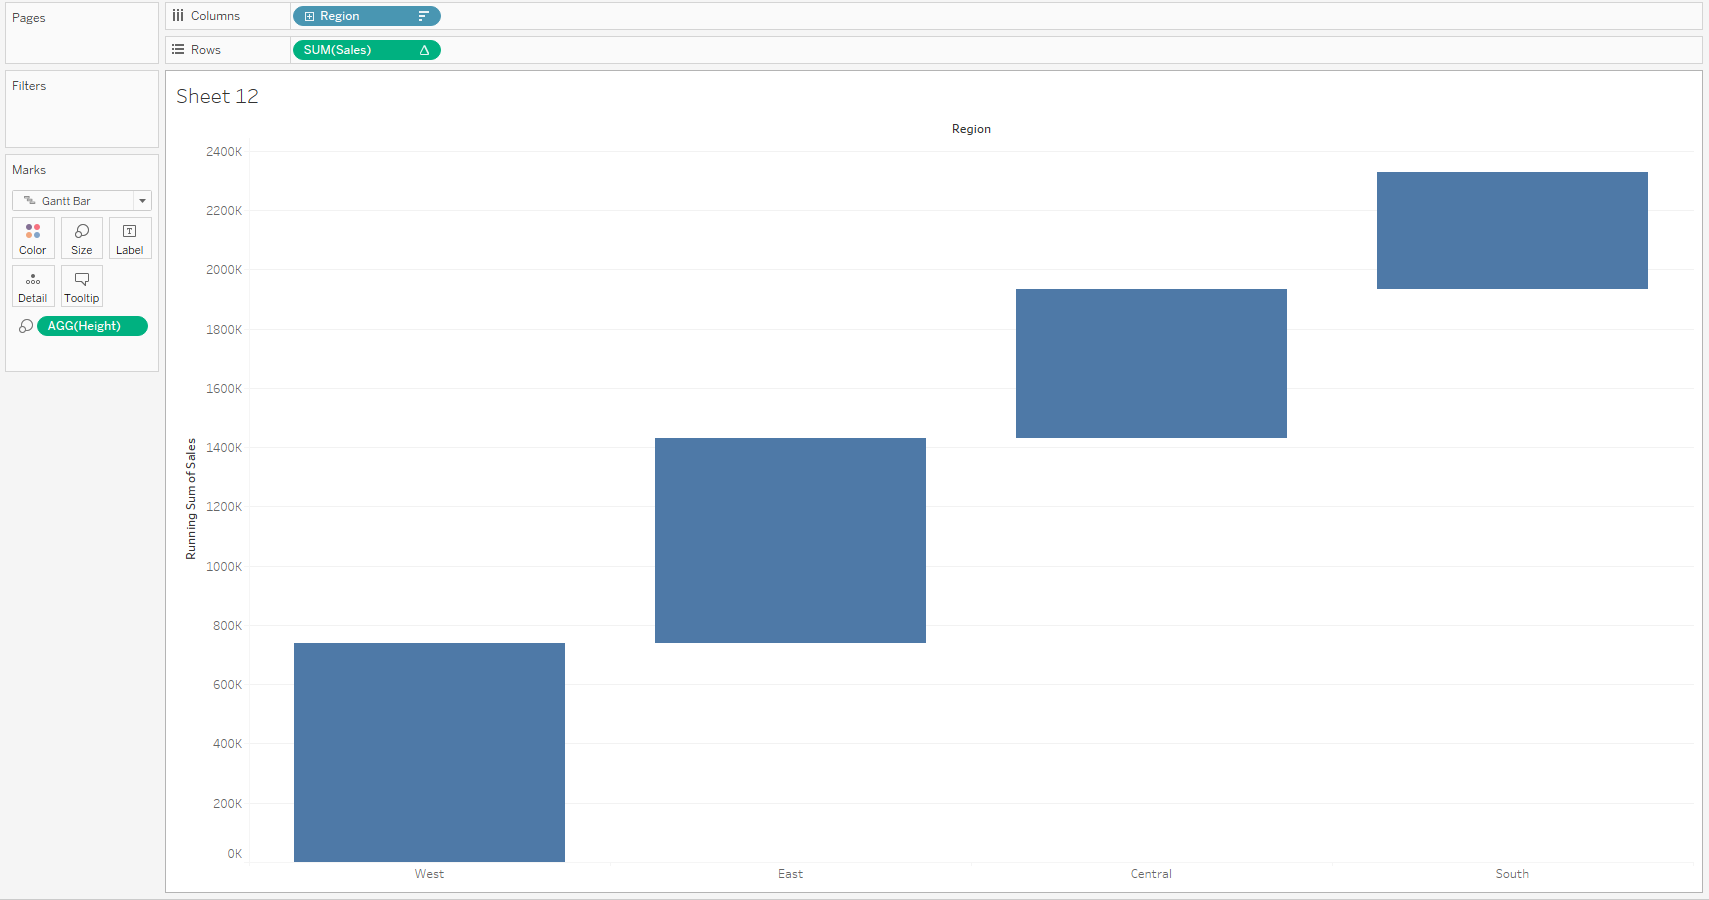
2. Calculate a running total on sum of sales and change marks to Gantt bar.
3. Create a calculated field called Height to show the height of waterfall.
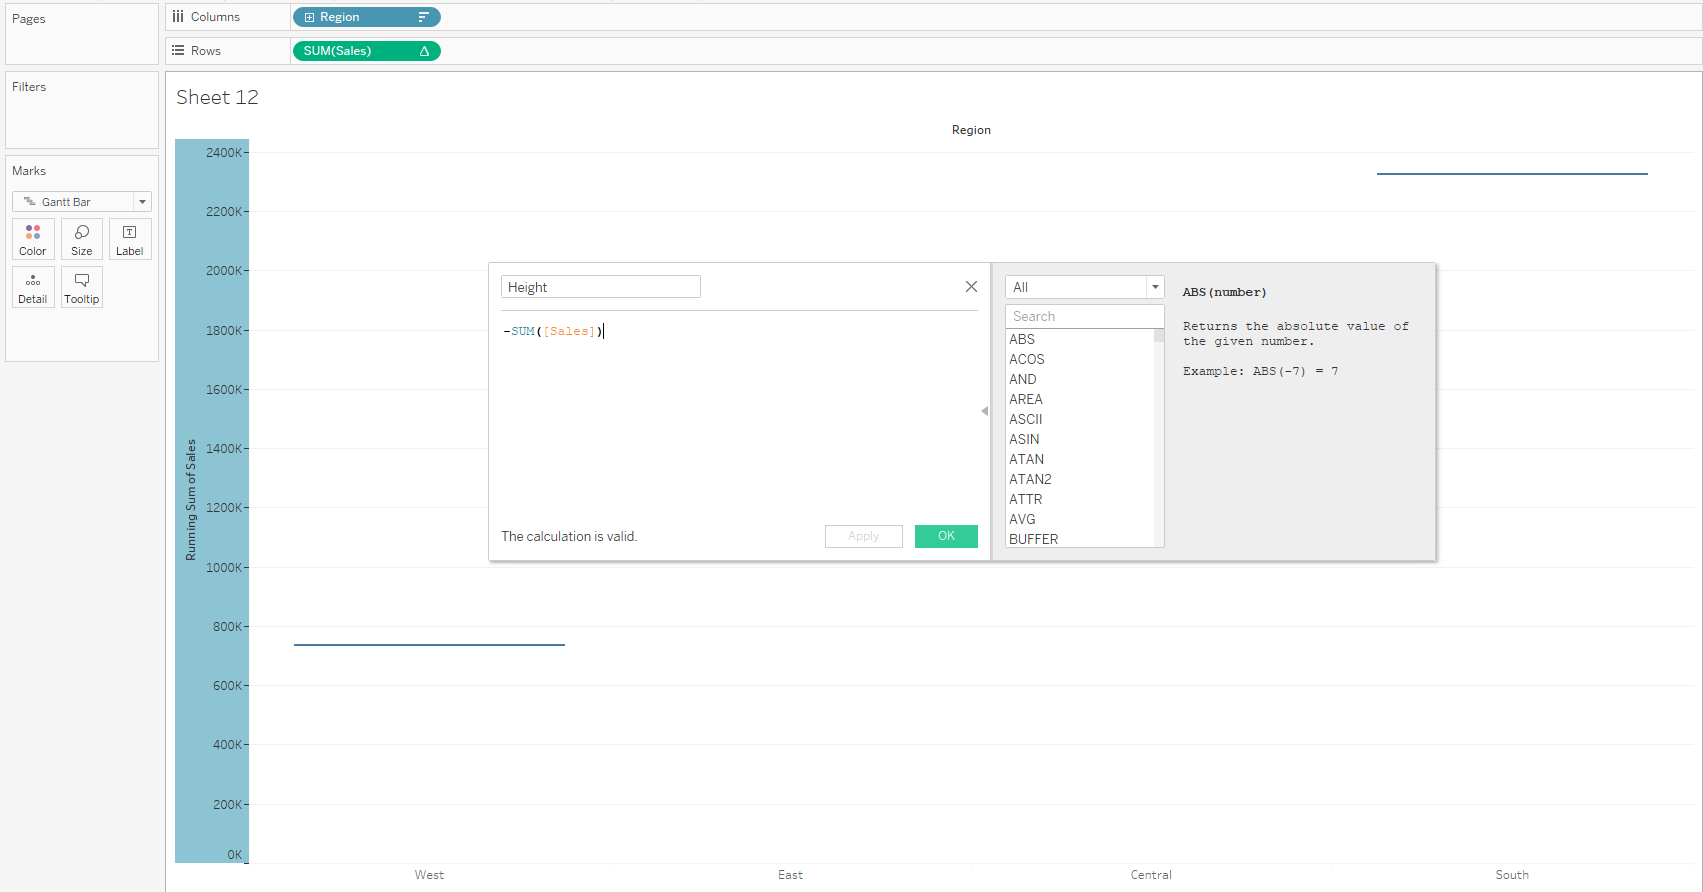
4. Drag height to size on the marks card.
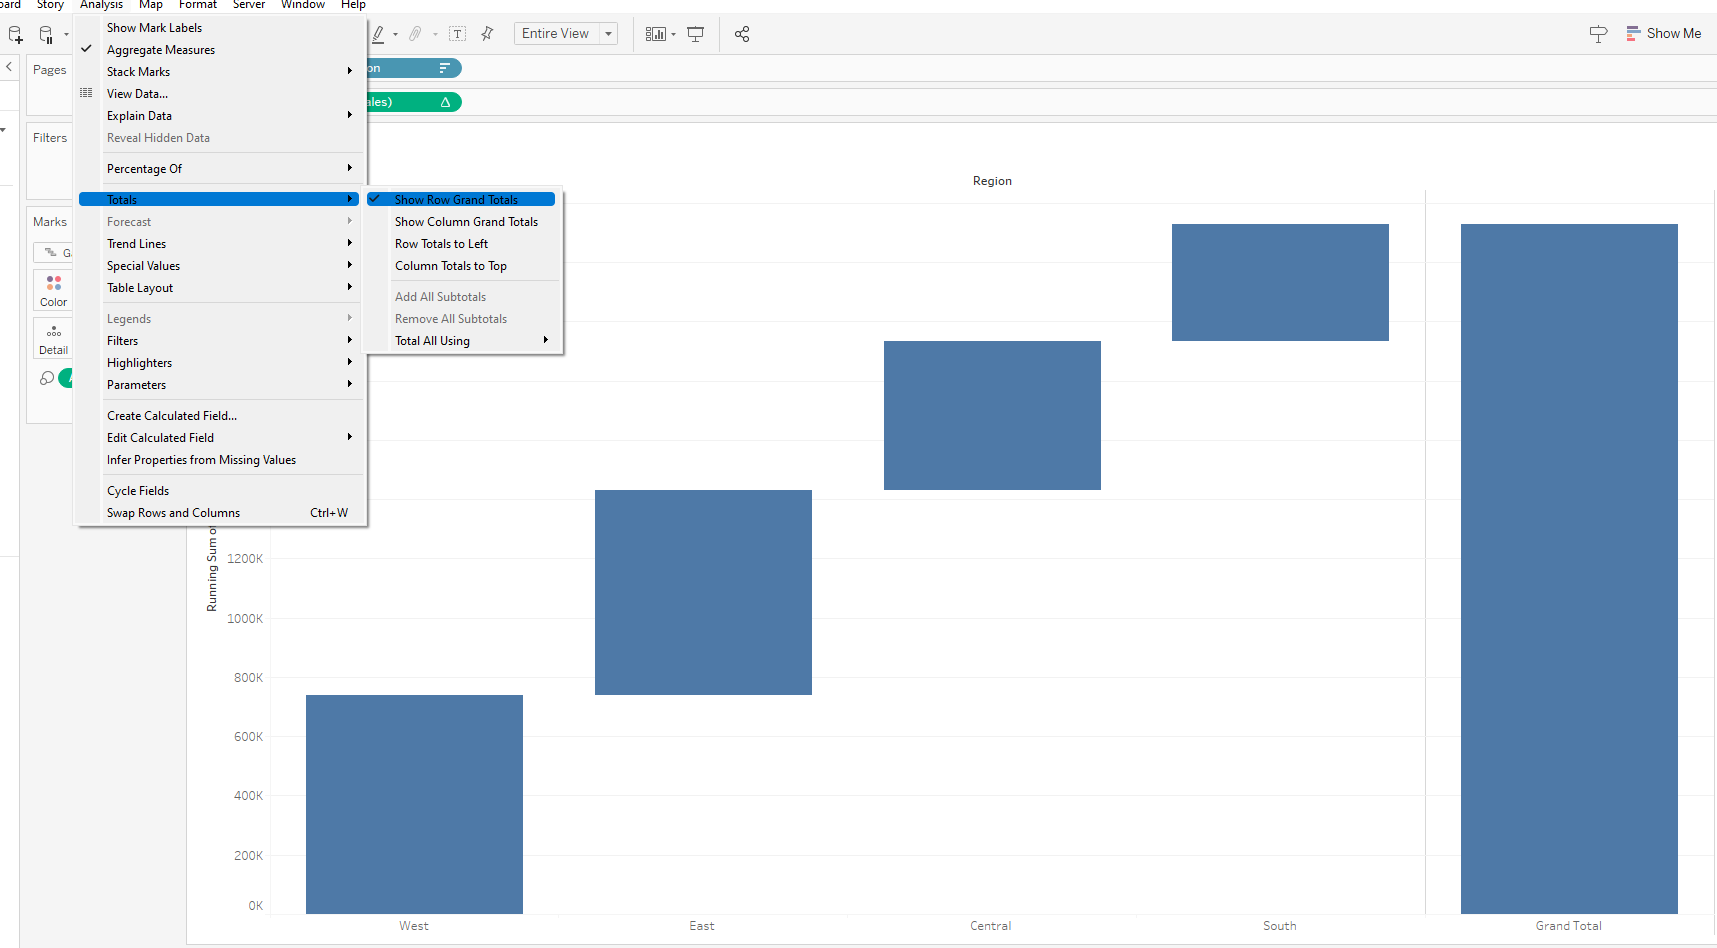
5. Show row grand total from the analysis tab.
6. Drag sales from the data pane to colour.
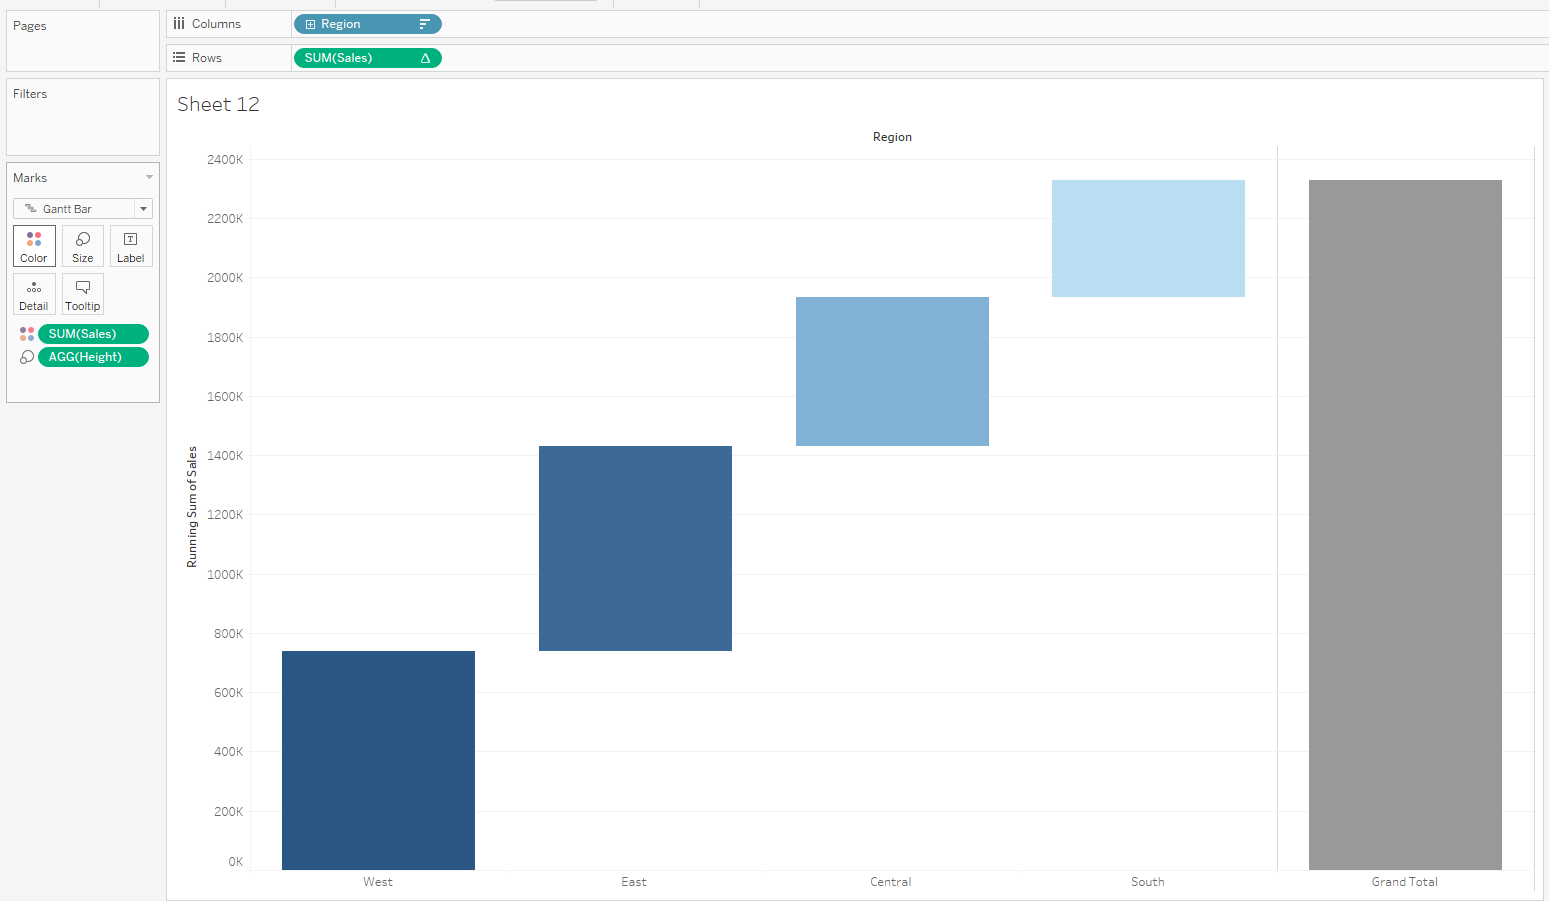
A waterfall chart is complete by the following steps, pending further formatting and calculations if required. I hope this helps and thanks for reading.