


In this blog I would like to write about how this week's client project went. For those who don’t know what that is, each week we work with a different client who brings us a specific case. We then have three days to analyse the data, work as a team, and deliver our results.
However, this week was a bit different. Instead of working with an external client, our coach Peter took on the role of our client. We were divided into three groups of two, and each group received a different theme to explore.
My group’s topic was based on U.S. domestic flight data for the year 2024 (with a table with a total of over 7 million rows 😲) . We had the freedom to explore the dataset, to analyze it, find interesting insights, and decide what kind of story we wanted to tell through the data. So here is how the week went:
Monday
We always begin with a Kick-Off Meeting with the client, and this time it was a quick one. Even though our client wasn’t external, we still worked with real data, which makes for me particularly a huge difference compared to mock data.
Mock data is usually simpler and doesn’t really always reflect real world challenges. But with real data you can actually discover real insights and patterns, and I was really excited about that.
After the kick-off, we decided to google a bit more about our “client”, the FAA (Federal Aviation Administration). From that, we came up with two user stories to guide our work. For this blog I am gonna focus on the first one, which was:
“As a FAA executive leader, I want to view a clear, high-level dashboard summarizing key performance indicators (KPIs) and top/ bottom airlines and airports, so that I can quickly understand national aviation performance, identify major operational challenges (e.g., delays or cancellations), and communicate key insights during the annual review meeting."
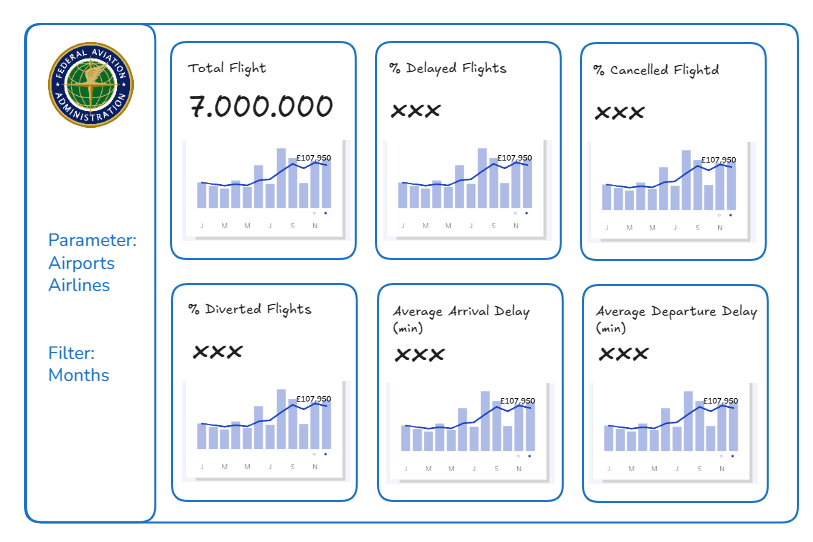
After that we divided our tasks and we moved on to sketching. Sketches are very helpful because they let you organize your thoughts and check if everything makes sense visually before jumping into building the actual dashboard. Here is ours:
In the afternoon, we had our check-in meeting with the client (Peter), where we showed our initial idea and got some feedback.
Wednesday
It was our second project day, and it was all about dashboarding in Tableau. There’s not too much to say about this day. We basically took our sketches from Monday and started building the real dashboard in Tableau.
We also had another check-in meeting with our client/ coach to show our progress and get more feedback.
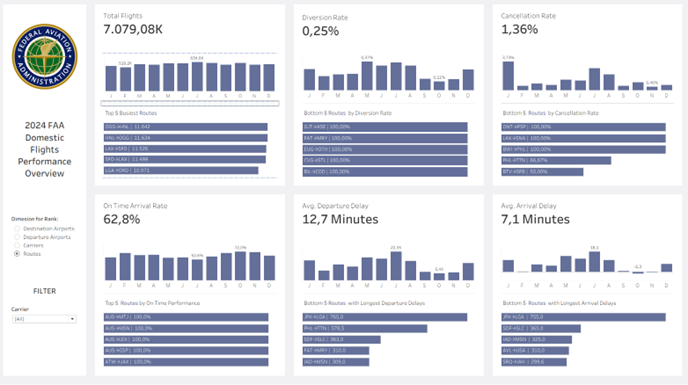
Now, a little bit about the dashboard: It is an overview dashboard with six different KPIs. Below each KPI, there’s a bar chart showing the seasonal trend for the year, so you can quickly spot which months were good, bad and trends. Under those, we created a ranking section using a parameter. With it, you can choose to see the top or bottom five for each big number for airports, routes and carriers (airlines). We also built a filter for the 15 differnt carriers on our data set. So they can have an overview for all carriers or analyse each one seperately.
Thursday
Normally, we have our client presentations on Friday, but since we had something else planned for that day, this week’s presentation happened on Thursday instead.
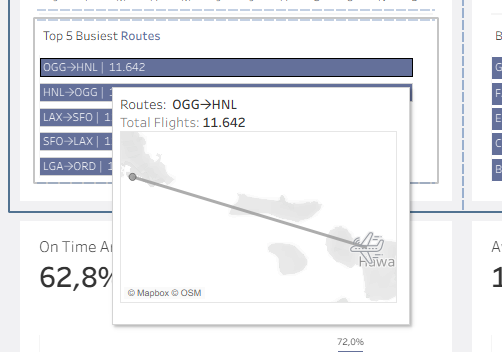
In the morning, the dashboard was basically ready, but I still wanted to add some small details that I didn’t have time to finish before. One feature I was really excited to show was in the tooltips for the routes: when you hover over them, you can actually see the route displayed on a map,which adds a nice interactive element to the dashboard. It was very hard to implement it, but with the help of our coach it worked out just fine. 😄
In the afternoon, we had our presentations.. There were, of course, a few things I still want to improve after feedback. For example, I’d like to add a different color for the months, to highlight the max and min values for each of the six bar charts. That would make it easier to quickly spot which months performed the best or worst.
Another thing I want to adjust is the ranking parameter. Right now, it only shows one option for “bottom 5” for the KPIs where higher values are worse (like average delay), or “top 5” for KPIs where higher is better (like on-time performance). But I’d like to add a parameter that lets the user switch between viewing the best or worst five airports, carriers, or routes for any KPI. The bottom ones are good for identifying where attention is needed and the top ones to learn some best-practices from.
Overall, I’m happy with how the week went. It was an interesting project, and the best part was definitely working with real data and data I am really interested in. It makes the analysis much more meaningful, because you can actually uncover real insights and stories behind all those numbers.
Here is our final overview dashboard:
Because it's all public data, I've also uploaded it to Tableau Public and you can check it out if you'd like by clicking here. 😄