The task today is to scrape data from bundesliga.com dating back at least 20 years and create some meaningful visualizations with the data. To achieve that, 3 things are needed:
- Design and run an Alteryx workflow to scrape interesting data from the web page
- Some conceptual brainstorming resulting in a sketch of the dashboard
- The final dashboard on Tableau Public
In the following sections, I'll go through each of these steps one by one and will end with a link to the actual finished dashboard
Data Ingestion & Preparation
Alteryx web scraping workflow
- split to rows using newline character '\n'
- trim away unnecessary characters: split by '>' 3 times, only keep the last column
- find where the data of interest begins, drop everything before (regex parse: '''"entries":(.*)$''')
- parse the remaining data with the JSON Parse tool
- split the data per club (text-to-columns tool), drop fields & assign data types
- cross-tab to wide format
- add additional year field in proper date format
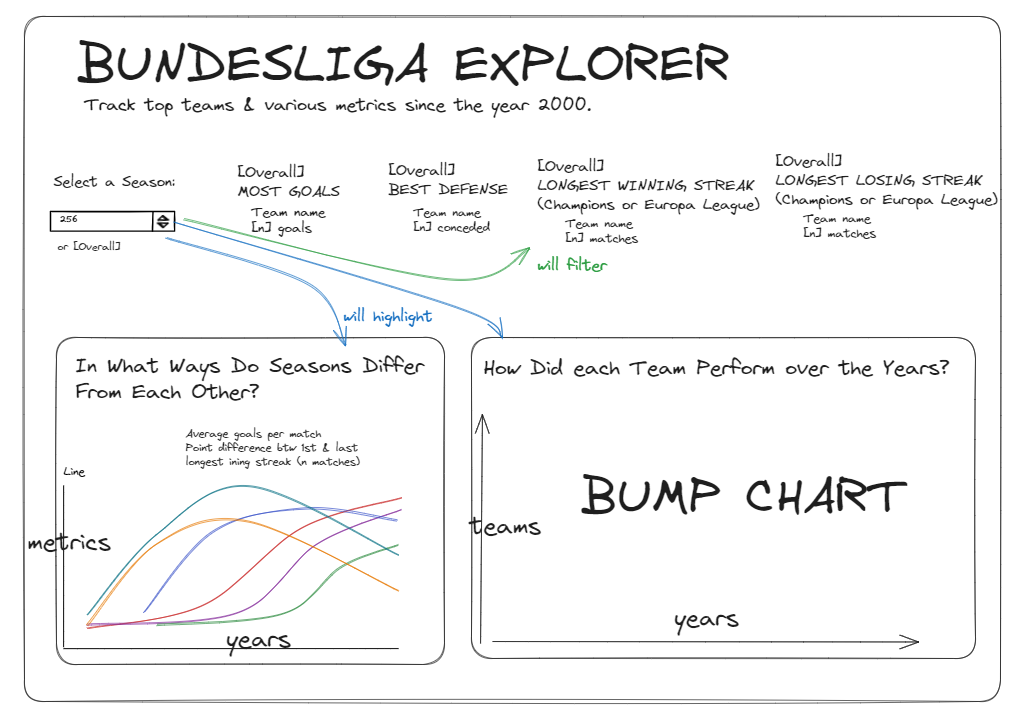
Plan
After a 30m session of brainstorming, this sketch is what I have come up with given the somewhat limited depth of the data:
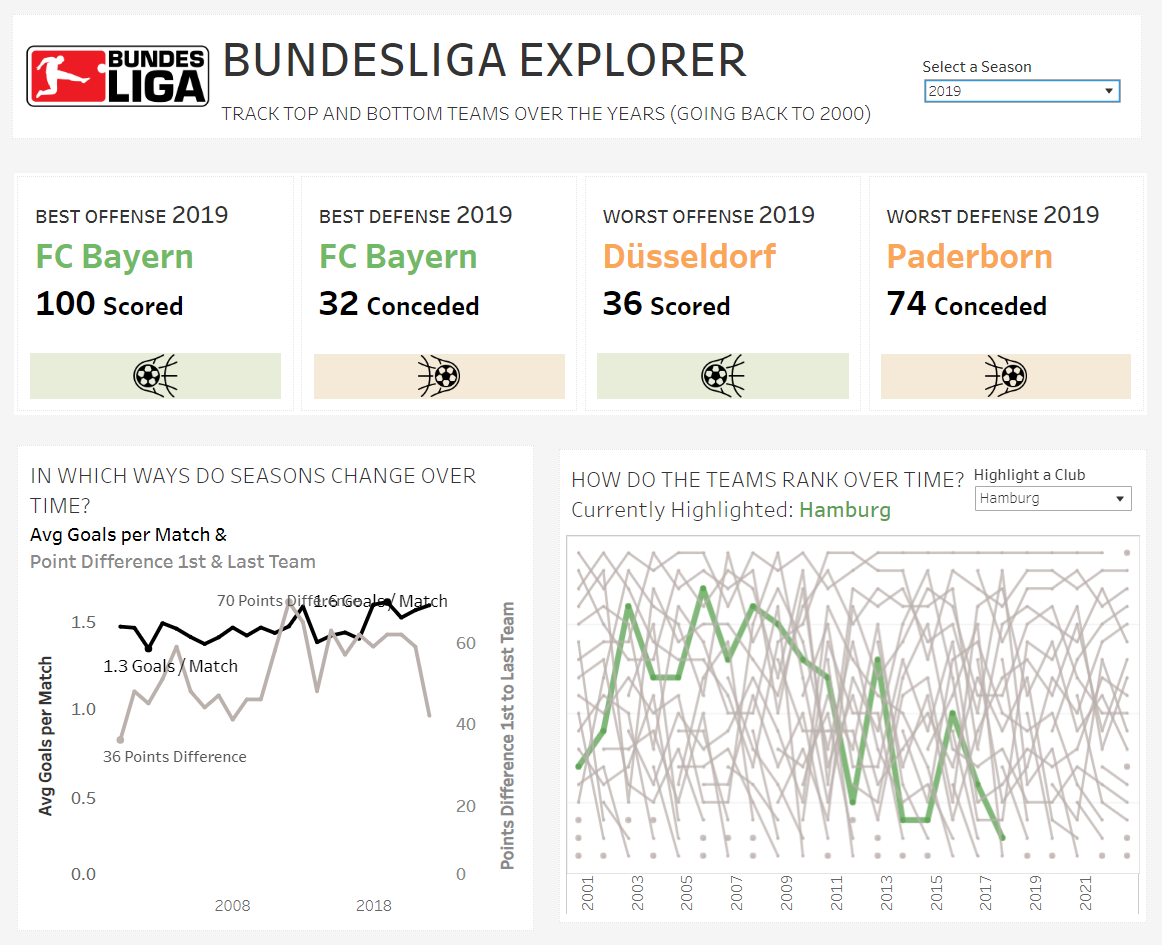
Product
After finishing the sketch, there have been about 2:30 hours left for the actual Tableau work. Given the time constraints it's been clear from the start that today's work won't win any design awards. I personally have been defining success on a successful implementation of the sketch. So here's the link to the dashboard. I'm happy I have been able to 1) get & prepare the data in time, 2) plan realistically and 3) successfully put that plan to action: