Why not give your CV a little makeover and showcase your Tableau skills in one go? Tableau can be utilized effectively to display information in a manner that's easy to grasp, so why not visualize the milestones of your professional life?
This has actually been a task for us to complete in one day. For inspiration, we have been given some helpful inks. For example, there is a whole gallery of interactive resumes to get inspired by. Also, this blog details the steps needed to generate your own data if you'd like a Gannt chart of past and current positions to be the central visual element of your CV.
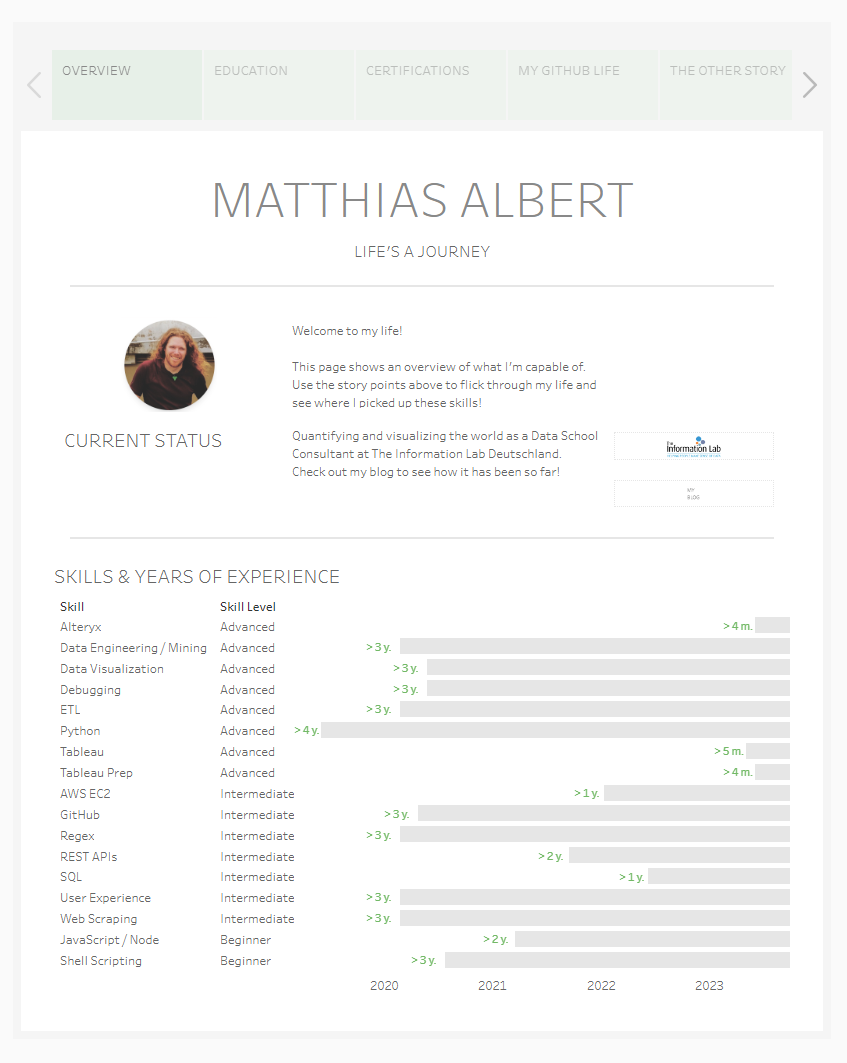
Anyway, after putting in a day's work and focussing on my own past and current activities, this visualization is what I came up with. After some thought, I felt I'd like to have various printable pages, each page highlighting a different aspect of my life. Story-like text elements should then help glue together the different aspects of the story which brought me to where I am today.