(for Beginners)
This guide is for those new to Tableau who want to create their first donut chart. A donut chart is essentially two pie charts stacked on top of each other. It has a clean look and makes use of the empty center space to display key numbers that would otherwise go unused. Let’s get started!
Prerequisites:
- Download Tableau Desktop (Tableau Public is free)
- Load the Sample Superstore dataset (used in this example) or your own dataset
- Open a new sheet
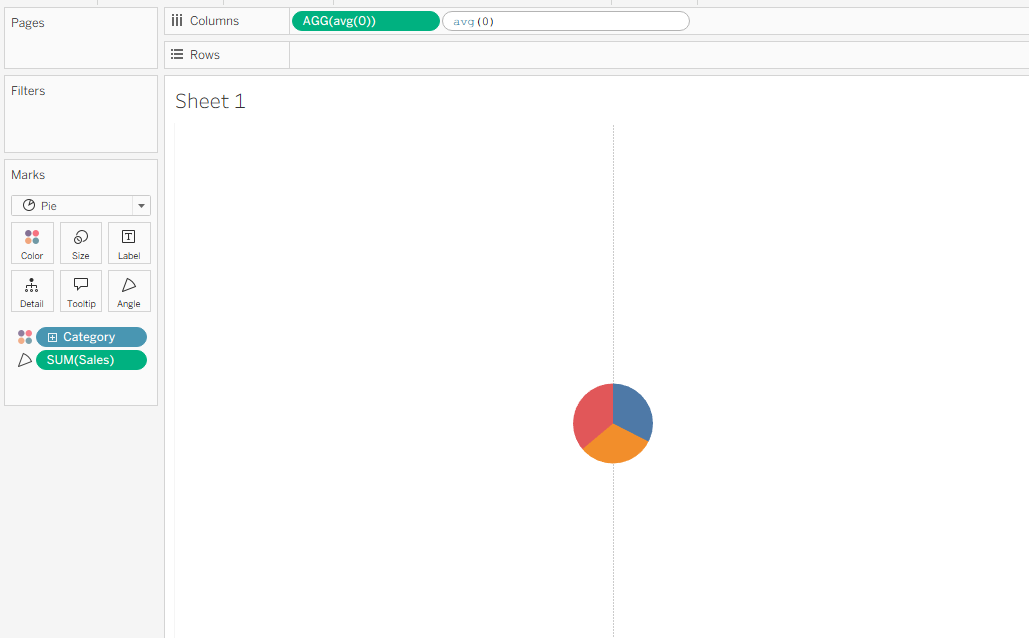
Step 1:
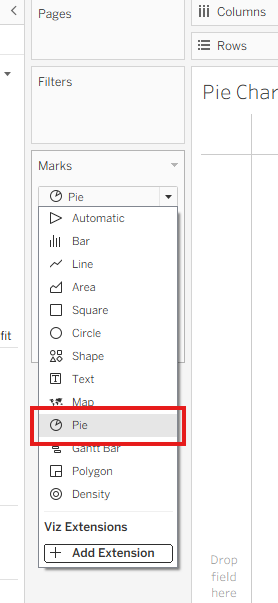
Before adding any data, set the Marks card to Pie. This enables the Angle option on the Marks card.
Step 2:
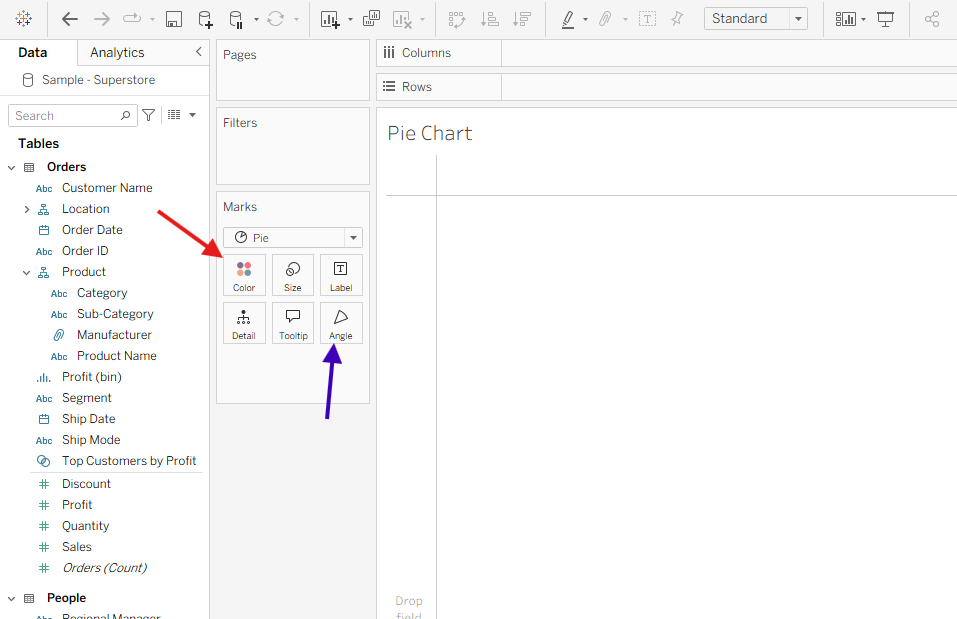
Drag your measure (e.g., SUM(Sales)) to the Angle mark, and your dimension (e.g., Category) to the Color mark.
Step 3:
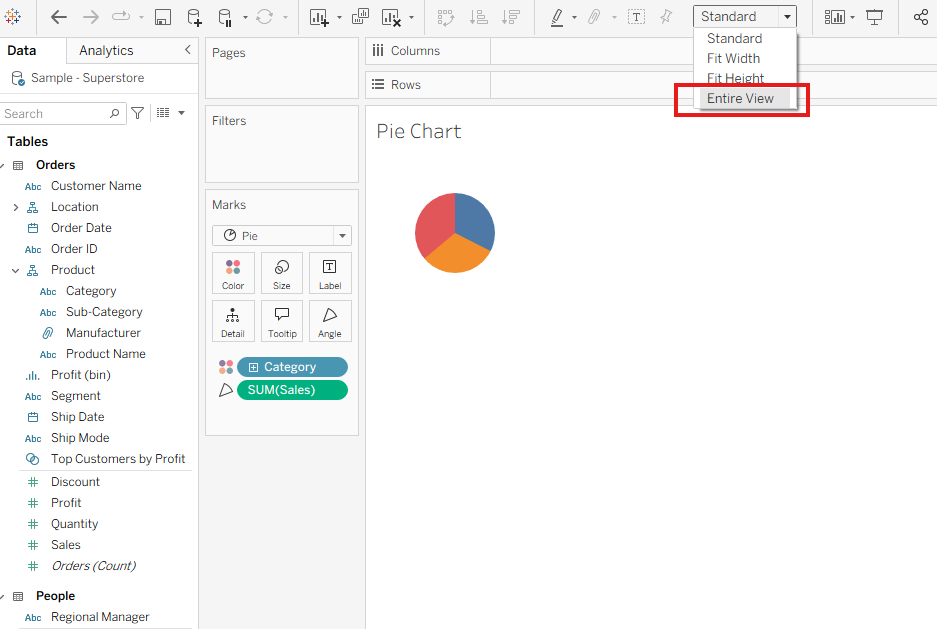
Change the view from Standard to Entire View for better visibility.
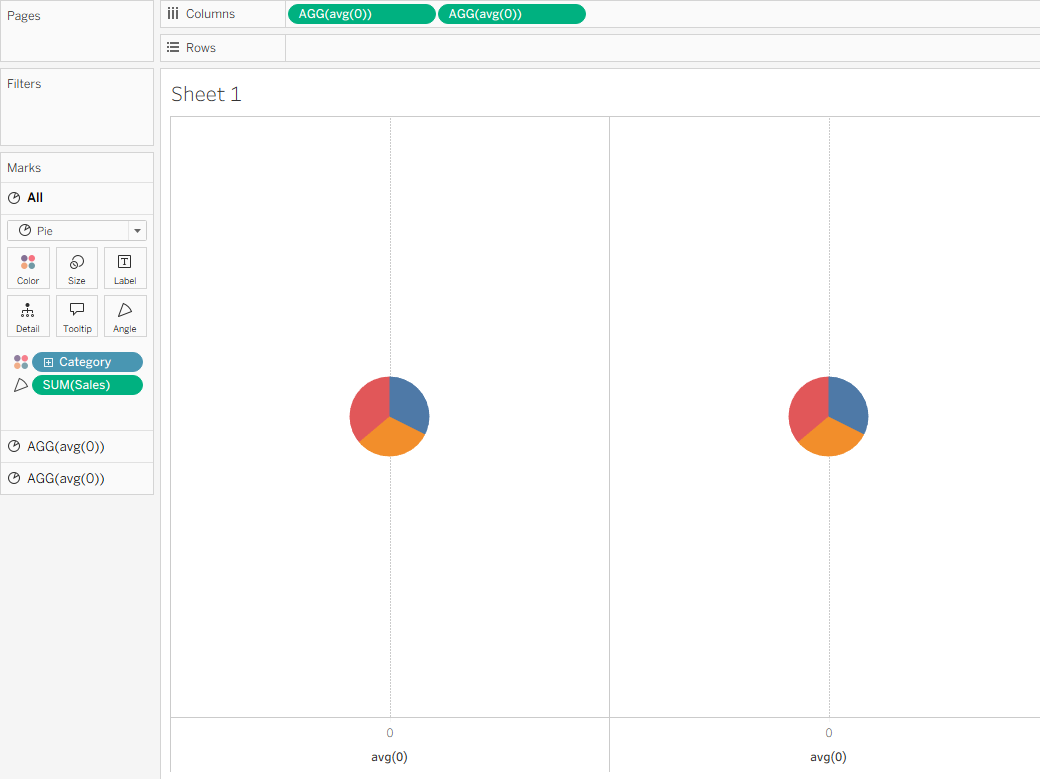
Step 4:
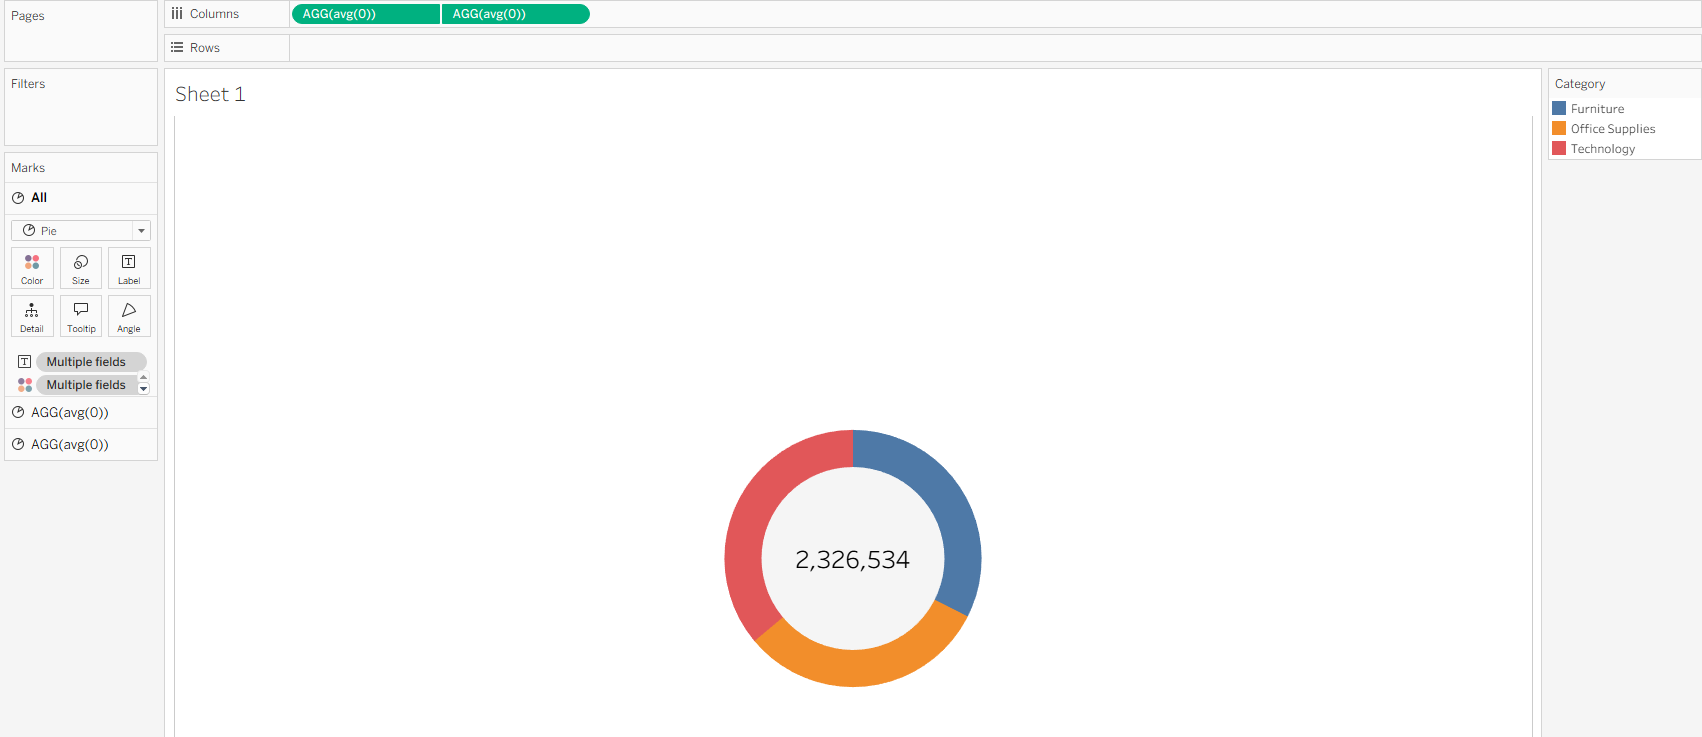
Create a second pie chart by typing AVG(0) directly into the Columns shelf. Do this twice so you have two pills: AVG(AVG(0)).
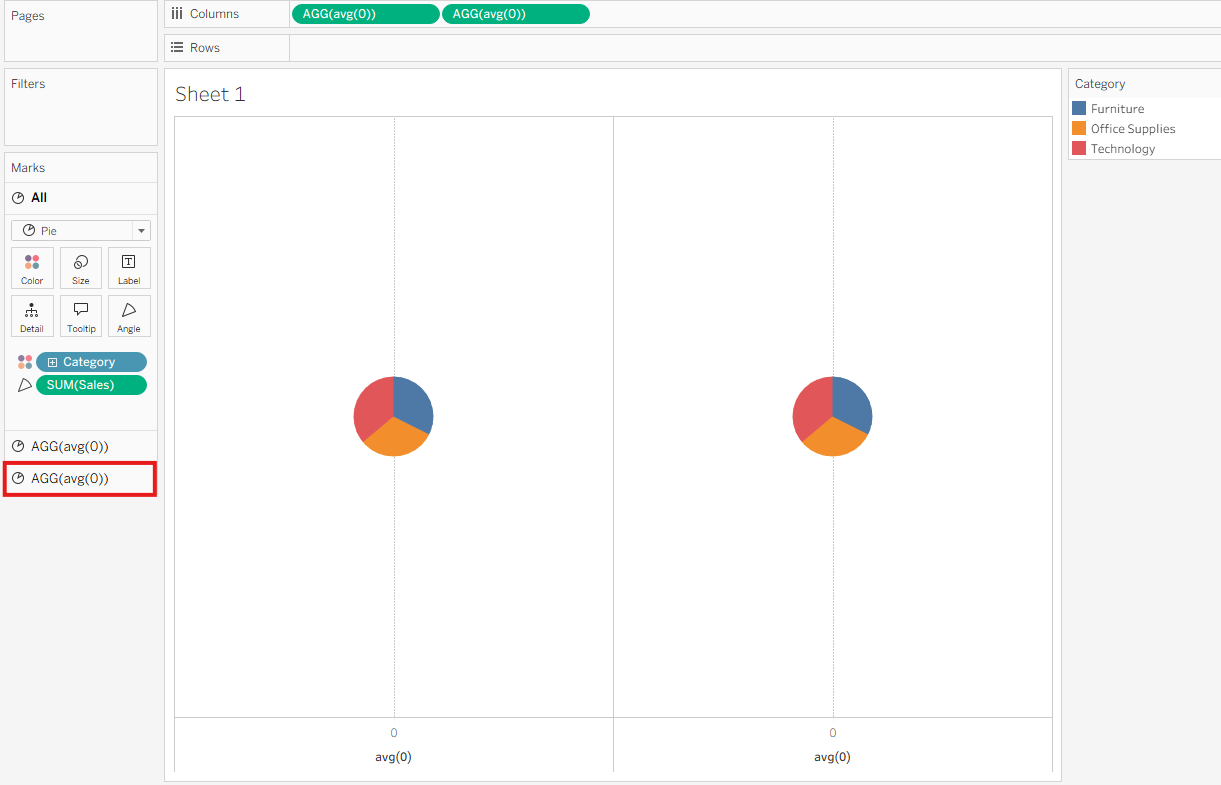
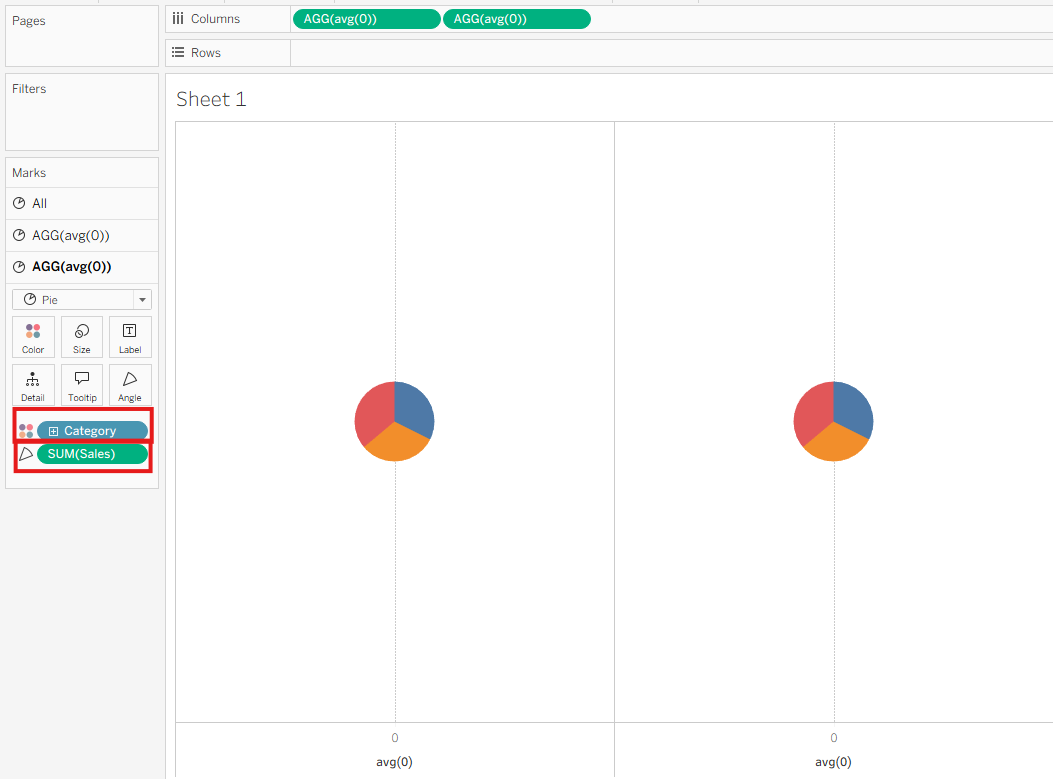
Step 5:
Select the second pie chart on the Marks card. Remove Sales and Category (or your selected fields) from the Angle and Color marks.
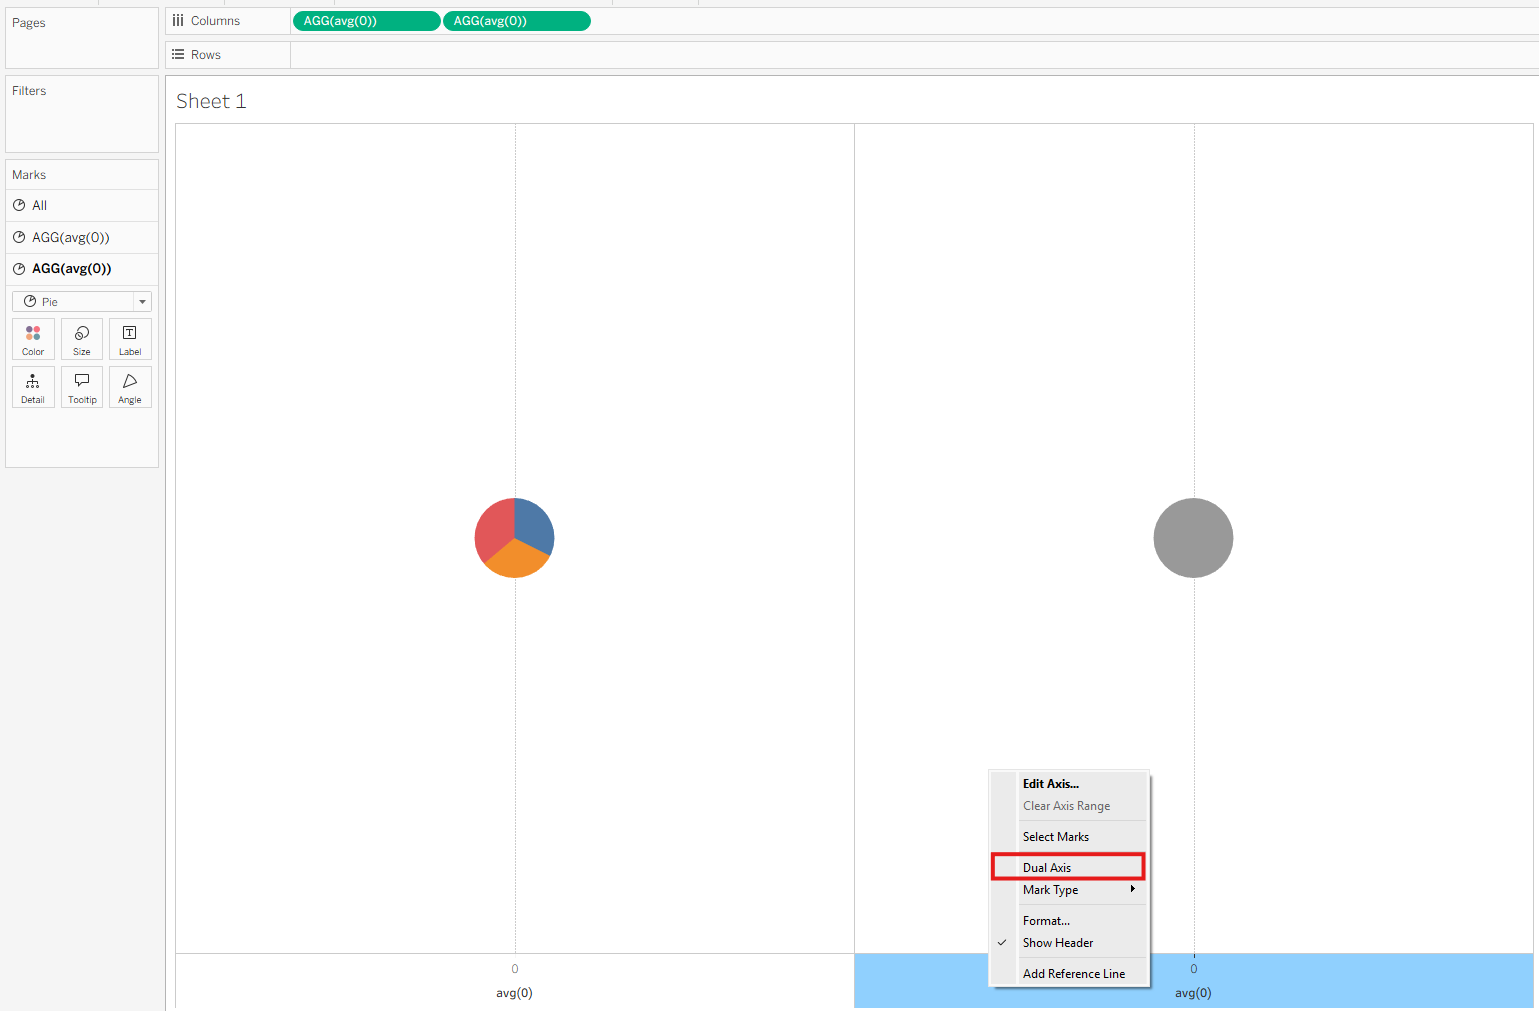
Step 6:
Set the chart to Dual Axis and adjust the size of each pie to achieve the desired donut effect.
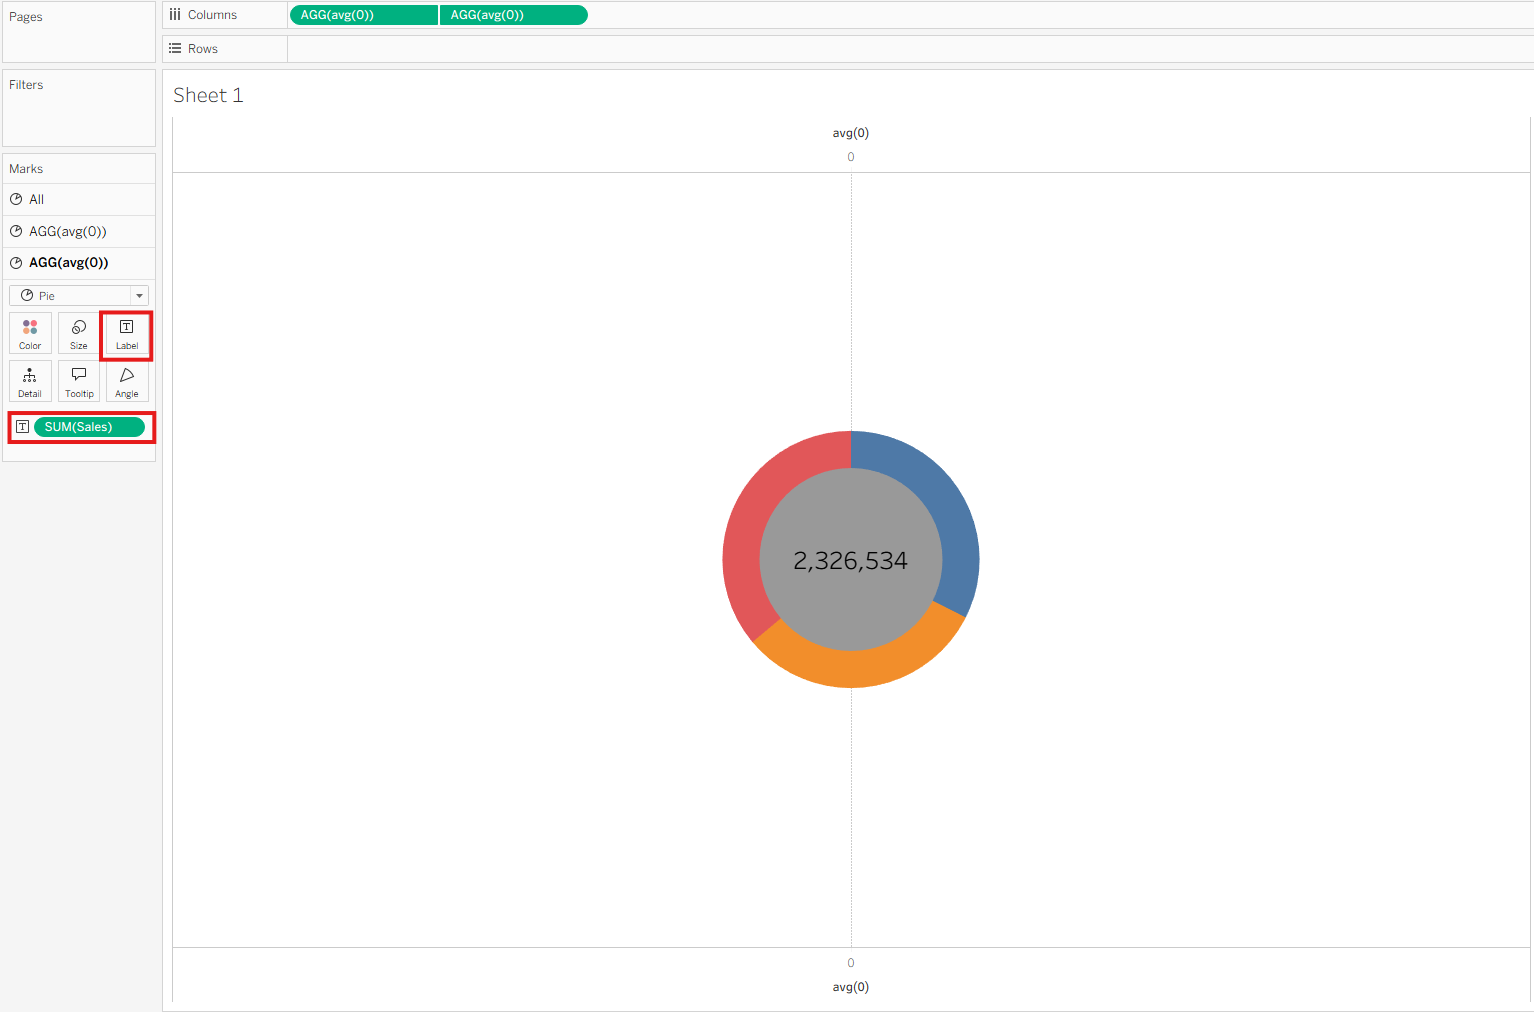
Step 7:
Drag your measure (e.g., SUM(Sales)) to the Label mark to display text inside the donut.
Step 8:
Clean up the chart:
- Change the color of the inner circle to a lighter grey
- Right-click the axis and uncheck Show Header
- Right-click on the chart, select Format, go to the Lines pane, and set Zero Lines to None