


For the last day of Dashboard Week, we were tasked with creating an infographic dashboard using Goodreads data. We needed to use Tableau Prep to clean and prepare the data, then build the dashboard in Tableau Desktop. If you are interested in using the data yourself, you can find it here.
Planning and Preparation
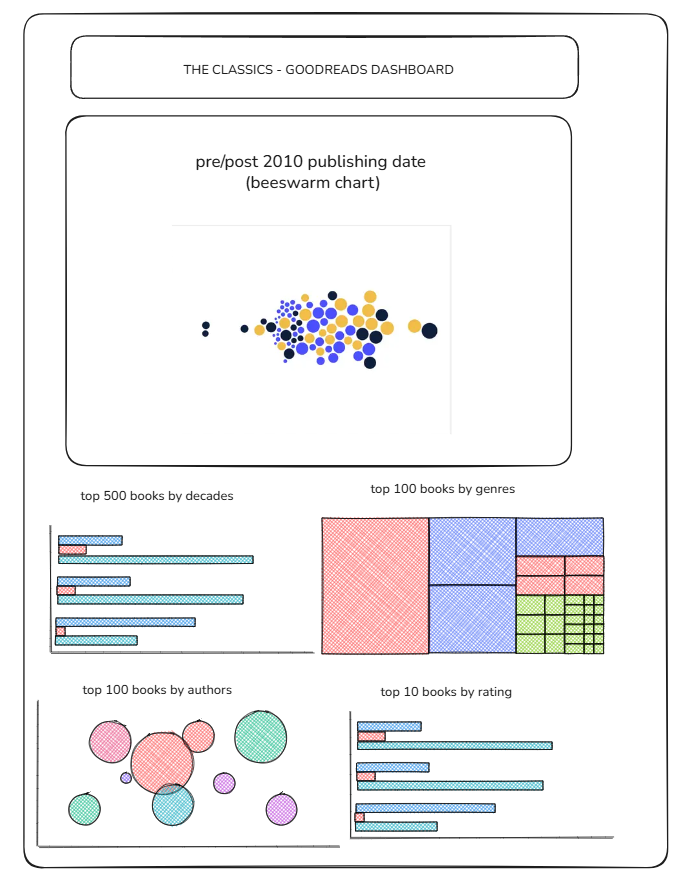
After cleaning and preparing the various tables in Tableau Prep, I was able to bring them into Tableau and create the necessary relationships. I then began creating charts to explore the data, experimenting with different visualisation techniques and chart types. Once I had a plan in mind, I used Excalidraw to create a sketch.
Building the Dashboard
I decided to make the main chart of my dashboard a "Beeswarm" chart using a Viz Extension. This creative tool creates shapes that multiple metrics can be applied to, using colour, size, and location to visualise data. I used this chart type to show books published before and after 2010.
The other charts on my dashboard then guided the user through a story, explaining why so many of the highest-rated books on Goodreads are modern. It seems Goodreads users prefer post-2010 books to the classics.
To demonstrate this, I used a bar chart to break books into the decades in which they were published. This then flowed into a treemap chart that categorises books by genre, showing that fantasy leads the way on Goodreads since 2010.
The final two charts on the dashboard continued the story, showing that certain authors dominate Goodreads' "modern classics". Finally, I ended with a chart showing that the highest-rated books since 2010, most of which are fantasy or young adult fiction series, suggest that readers prefer the world-building of these works to standalone stories.
The dashboard is too long to screenshot, so use the link at the bottom of the page to see it on Tableau Public.
Final Thoughts
This was my final dashboard for Dashboard Week. It was my favourite task to complete and my favourite dashboard I have created this week.
This also brings my training at The Information Lab to a close, and I am excited to begin my first placement as a Data Analytics Consultant shortly.
Check my dashboard out here.