


Welcome back! In part 4 of my blog about analysing baseball data in Python, we'll be focusing on pitchers. We'll be re-using a lot of the code we wrote last week to get hitting statistics, and applying it to find good value pitchers for our fantasy baseball team.
Just like last week, we'll be creating our own "fantasy score." We'll use this to evaluate pitchers based on four hitting statistics:
- Strikeouts (SO)
- Strikeouts Per 9 Innings (K/9)
- Earned Run Average (ERA)
- Walks and Hits Per Innings Pitched (WHIP)
You can find more information about these stats here: https://www.mlb.com/glossary/standard-stats
I chose these four pitching stats because they gauge the ability of pitchers in high leverage situations through total strikeouts (Strikeouts), how frequently a pitcher generates strikeouts relative to innings pitched (K/9), their ability to prevent runs (ERA), and how well they limit baserunners (WHIP).
Just like last week, our code will pull the top 100 players for each of these stats and put them into separate tables, then join them into a single table that sums each player’s ranks across all four categories, letting us identify which pitchers perform well overall.
Players who perform well in multiple categories will receive a lower combined rank and therefore rank higher overall.
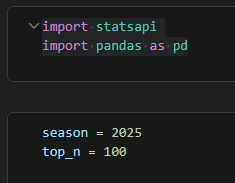
As always, we begin by importing our libraries and setting the season and top_n variables:
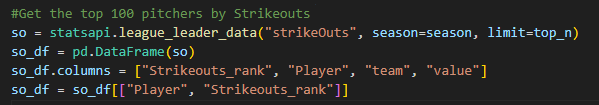
Then we get the top 100 pitchers by strikeouts.
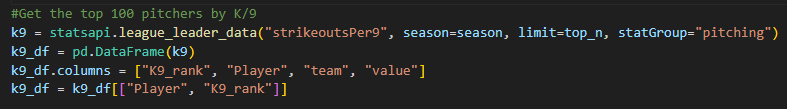
Next, we'll get the top 100 pitchers by strikeouts per 9 innings (K/9).
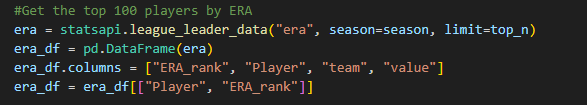
Now we'll get the top 100 pitchers by ERA.
And our last stat to get is WHIP.
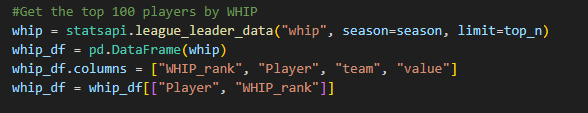
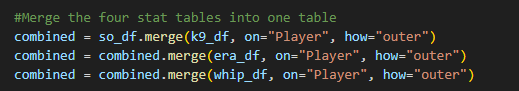
We then join these four stat tables we just made into one. For any players who are ranked in the top 100 for some stats but not others, we assign them a default rank of 101st for any stat where they do not appear in the top 100.
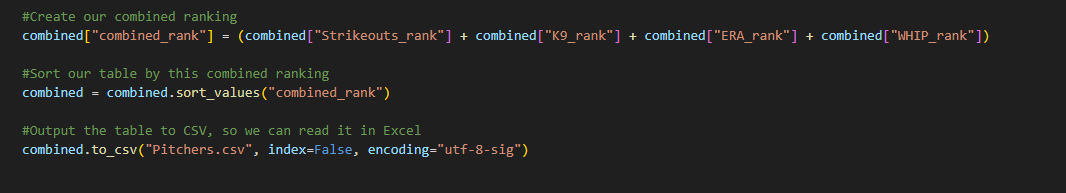
Lastly, we create our combined ranking by adding each player's ranks together. We then sort by this newly created rank and export the results to a CSV file so we can easily open it in Excel. We also make sure to output it in UTF-8 format, to ensure that accented letters and special characters in their names display correctly.
And we have our pitchers.csv file! Next time, we'll begin bringing our data into Tableau and visualising it. By building a dashboard we'll be able to easily find the perfect fantasy team.