


What is Tableau Next? Tableau Next is a flexible, API-first analytics platform built with a unified data layer and trusted semantics, and integrating Salesforce with Agentforce.
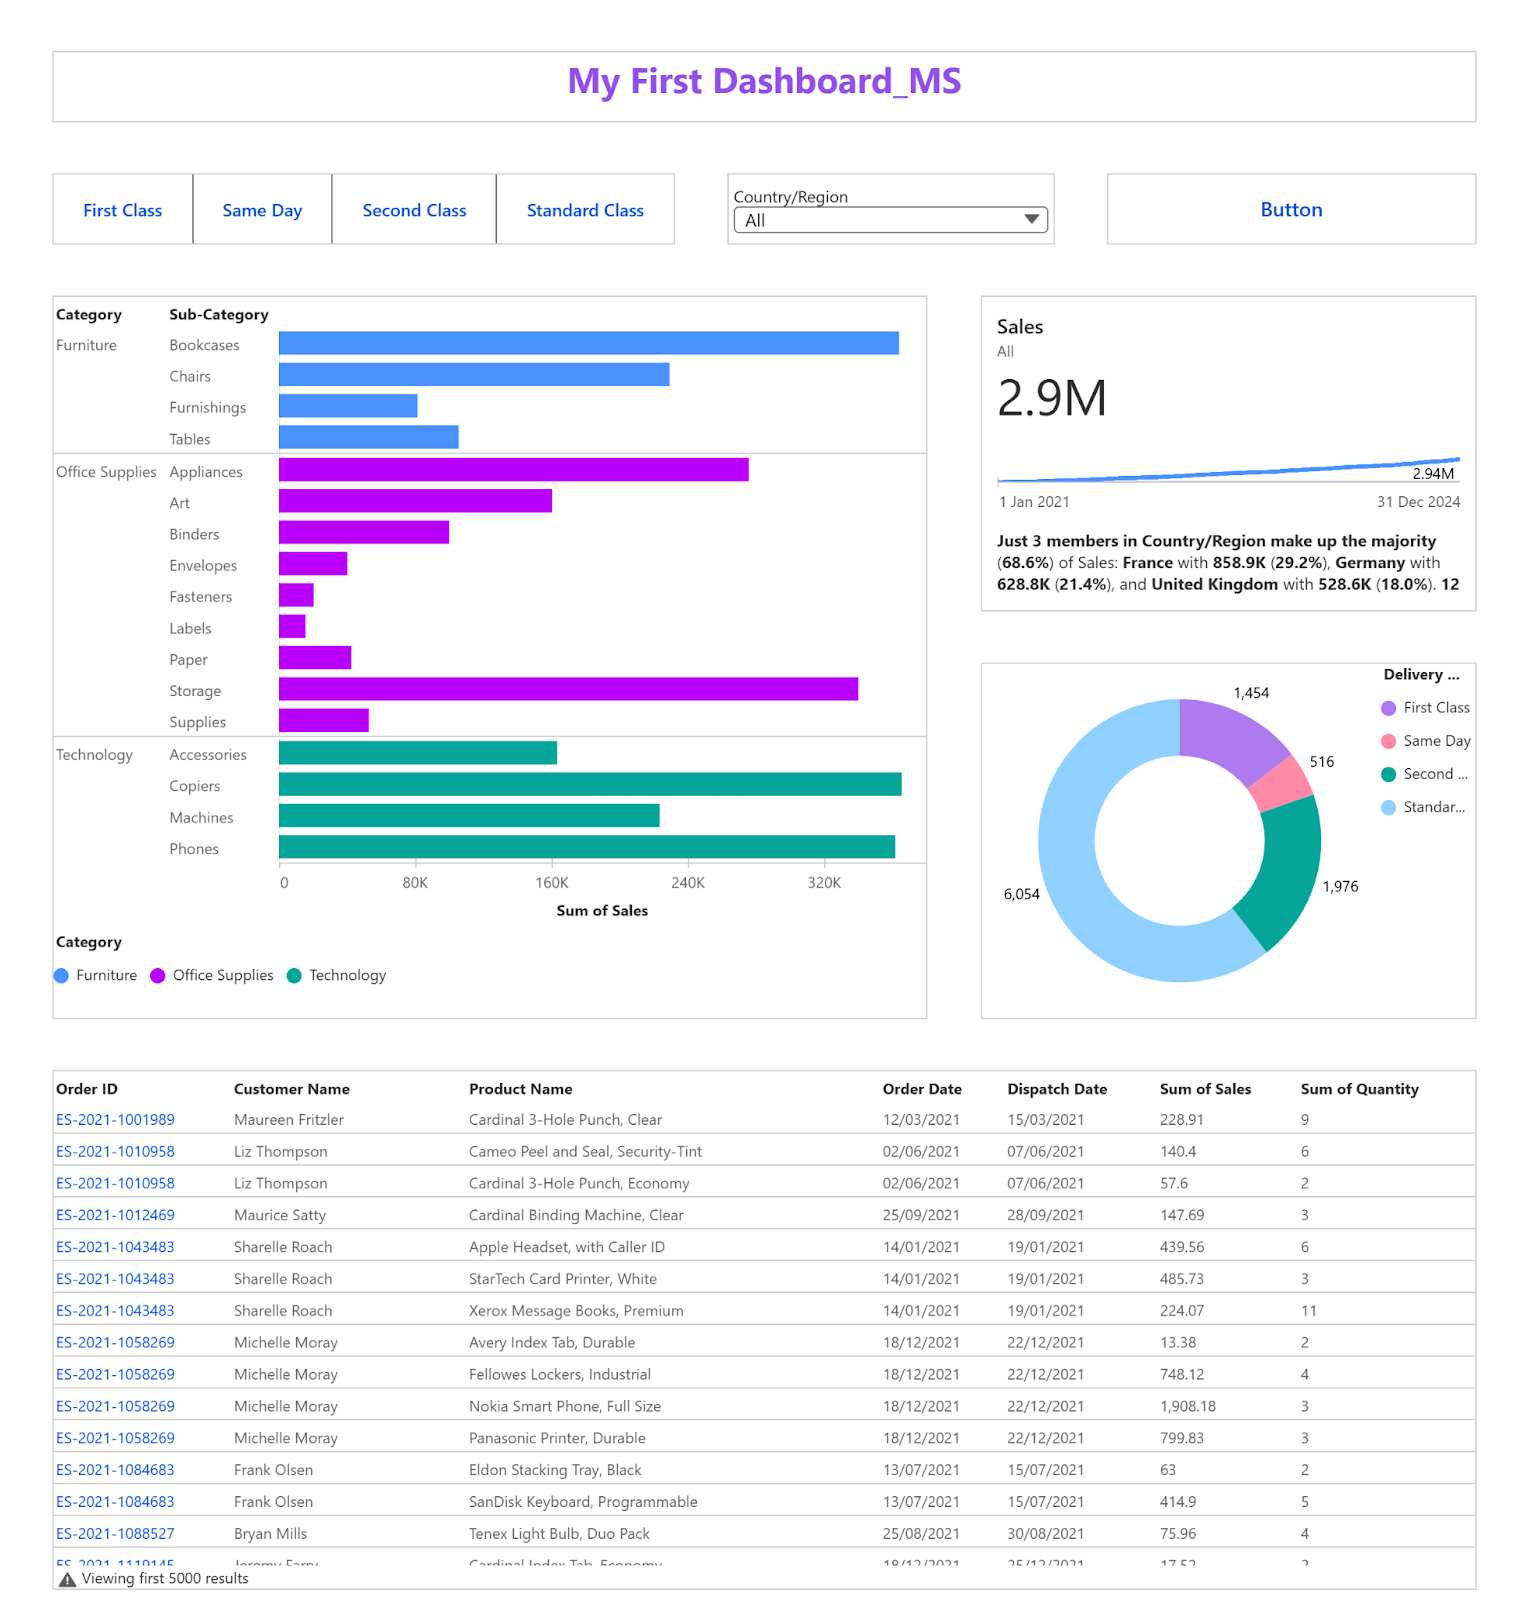
I want to show my first dashboard which I did in Tableau Next, it was quite quick and I want to share a little summary about working with Tableau Next.
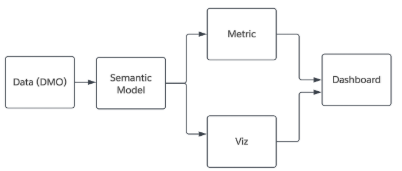
Process in Tableau Next:
About connection to data:
You can work with any data available in your workspace. This includes accessing information from an existing Data Model Object (DMO) in Data Cloud, connecting to a semantic model with an active data connection, or importing your own data from files or cloud-based sources.
Tip - if you want to join tables, then don’t forget to click Apply when you are ready, or you will lose your data relationships. Also, AI can help you with your relationships if you click on “Suggested Relationships.”
About semantic models:
Semantics add meaning by providing context to the data.
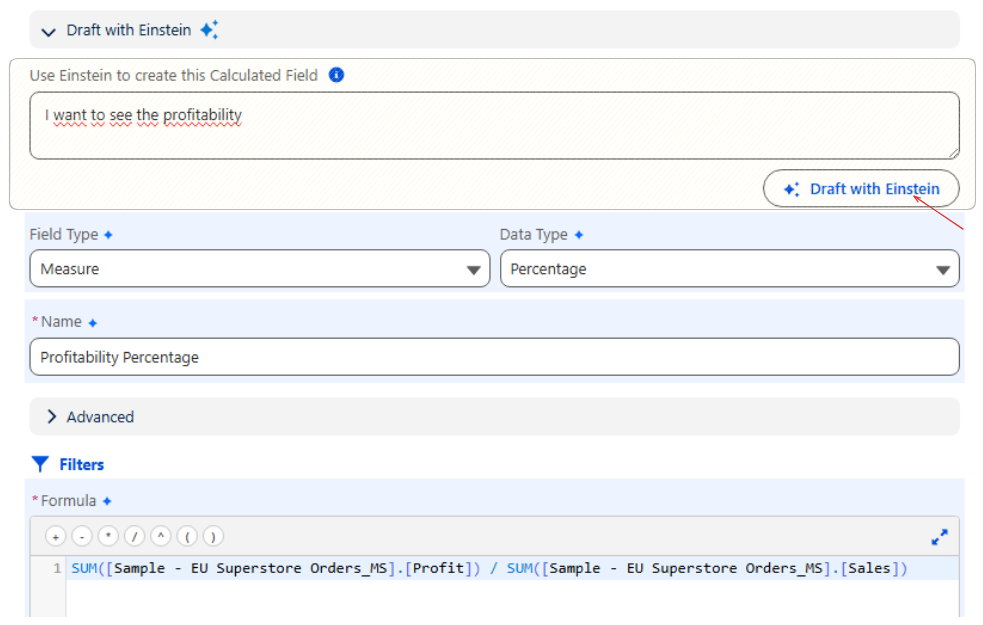
I like having the possibility in a semantic model to write calculations without remembering or knowing syntax— you only need to write what you want to have at the end to the AI assistant. For example, you can see in my screenshot below. I wrote “I want to see the profitability” and clicked “Draft with Einstein” and it generated a formula for me.
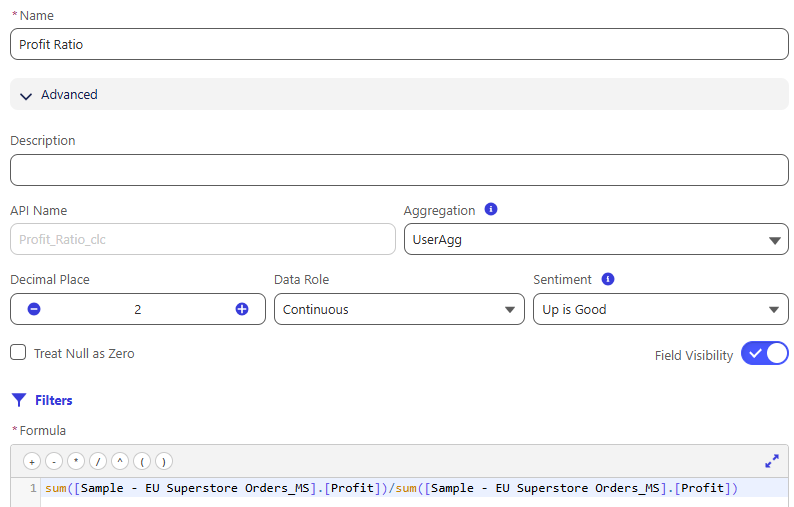
For the calculation, it is also better to add a description, as it makes it easier for Agentforce to search for the information later.
Don't forget to change the aggregation to userAgg if you use aggregation in your calculation, because it will automatically stay as Sum.
About building visualisations:
Vizzes are the units of analysis. A viz is a single chart or graph, built with a drag-and-drop Visualization Builder. Currently, in Tableau Next, you have a choice of chart types: table, bar chart, stacked bar, line, donut, scatter plot, and dot matrix. In the future, this will be updated and more chart types will be added. Also currently you cannot edit tooltips, and you cannot create a dual axis, but this may change with future updates.
And what is also important is not to forget to save every visualisation, because if you want to put it in the dashboard, then you don’t see it until it’s saved.
Also if you want to change the format view, you need to do it here (in the visualisation tab), because you cannot do it directly in the dashboard, and (as usual) don’t forget to save it.
About building metrics:
In Tableau Next or Data Cloud, metrics are created from semantic models and offer a simplified way to monitor how a measure changes over time. They can be organized and filtered by various dimensions. Also you can see insights summary for the metric below a visualisation.
About building dashboards:
A dashboard can contain metrics from Tableau Next or Data Cloud, vizzes from Tableau Next, and dashboard-specific widgets such as text, filters, and buttons.
All your visualisations you need to add through the buttons “Visualisation” or “Metric”, you don’t see it the same way as in Tableau Desktop on the right side.
I like to have the opportunity to put the visualisation on the dashboard and resize it how I want without containers, but I also don't like it, because it adds complexity. I also like to create toggles for easy interactivity.
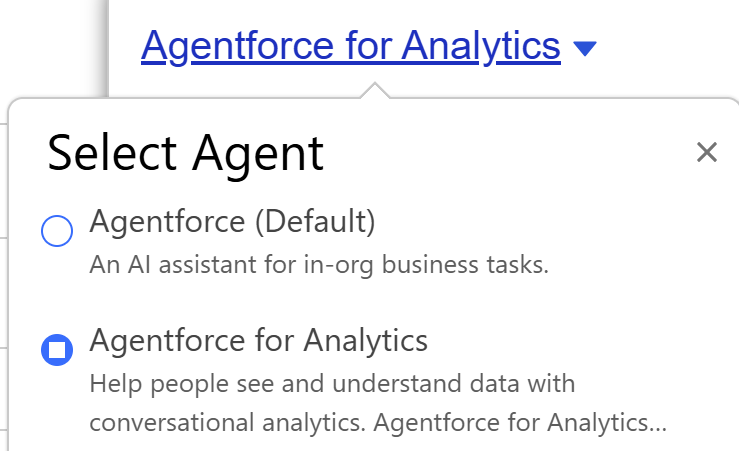
If you use Agent, then you have to choose between two options:
- Agentforce: The overall AI engine across Salesforce
- Agentforce for Analytics: A specialised implementation in Tableau Next that focuses on exploring data and generating visual summaries
Summary:
Cons:
- Compared to the Tableau Desktop, Tableau Next makes the user click more to perform the same action e.g. add a visualisation to the dashboard.
- Fewer visualization types e.g. maps and treemaps are missing
- On the Dashboard, you don’t have a title for the visualization. If you want to name your viz, then you have to use the text element.
- Pros:
- Agentforce is a good new feature.
- It’s easier to add buttons or toggles.
- Simple dashboards are quick to build.