


Today was the first day of Refresher week for DS52 (how time flies!!and ) our first challenge was to work on a personal project that we will present on Friday.
I decided to work on a dashboard focused on The Batman (2022) due to my personal interest in the franchise. This will include different sections that analyse the movie from various angles:
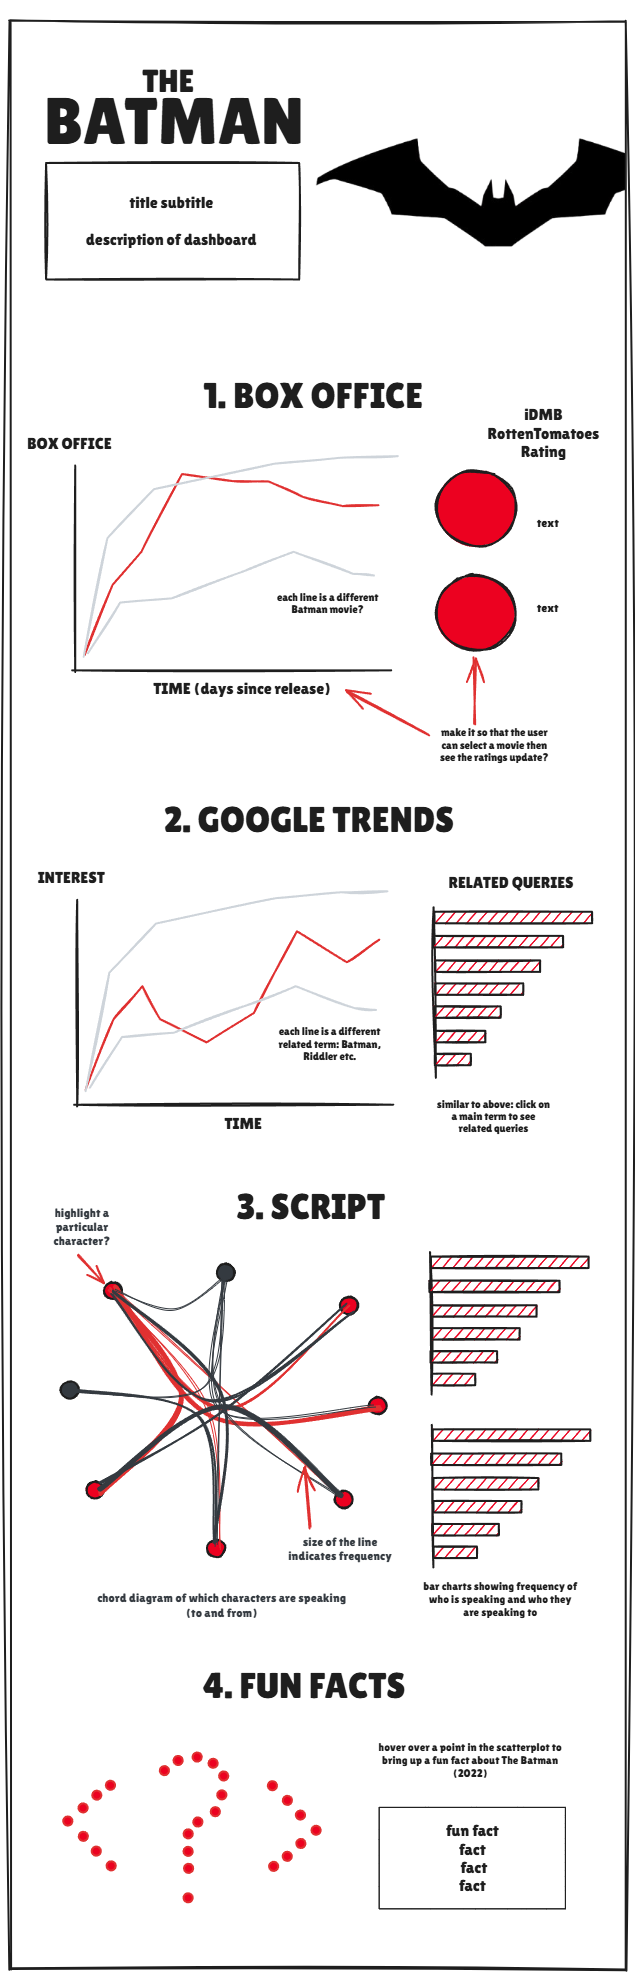
- Box office performance as well as IMDB and Rotten Tomatoes ratings compared to other Batman movies
- Google trends and search queries that provide an insight into fans’ thoughts
- Script analysis (which characters are speaking the most, who is speaking to who, which words are used the most, etc.)
- If possible, I would also like to do sentiment analysis in Alteryx to dive even deeper into the script!
- Fun facts from IMDB (however, this is of lowest priority as this section can be expanded upon and split off into another dashboard entirely).
Check out my Excalidraw sketch for my dashboard below!
Data
To complete this project, I am planning to collect data from multiple different sources:
- The Batman (2022) script - The Batman Universe Fandom
- Box Office data for multiple Batman movies include: The Batman (2022), The Lego Batman Movie (2017), The Dark Knight Rises (2012), The Dark Knight (2008), Batman Begins (2005) - The Numbers
- Batman-related search terms and queries on Google - Google Trends
- Movie ratings - IMDB and RottenTomatoes
- Fun facts about The Batman (2022) - IMDB trivia
Potential Challenges
As fun as it will be, there are a number of potential challenges that I foresee facing during this project:
- One challenge I'll face is gaining access to and cleaning most of the data required for this project. While some of the datasets are publicly available for download, the rest come in different formats and levels of completeness which means I will need to spend some time preparing them for analysis.
- In the interest of time, I think I can simply copy and paste some of the data from the websites they are hosted on (such as the box office and script data) and use Alteryx to clean and prepare them accordingly. However, I anticipate the data preparation stage for the chord diagram and scatterplot being the most time-intensive.
- The advanced radial charts, chord diagrams, and scatterplots that I plan to build are completely new to me so I expect to encounter some difficulties when creating and polishing these visualisations. However, I think learning this will be a good challenge for my technical skills (and also teach me some fun visualisation techniques that we haven’t learnt so far!)
Progress So Far
I have started cleaning the data for the script analysis - I think this still needs some more work as I figure out how to format the data so it can be used in the chord diagram.
I have also worked on collecting data on the box office performance of different Batman movies. For this project, I think I might focus on those that focus on Batman as the main character to keep the analysis focused (instead of all movies in the Batman universe).
After the first day, I think I can safely say that I may have bitten off more than I can chew since it's taken me a lot more time than expected to plan and gather the data. Nonetheless, I am excited to continue working on this project throughout the week and see what I can achieve!
Stay tuned to see how I get on!