


Today is my first time using Power Bi and its very weird to use. But one thing I do find better is that I can move the charts wherever I want unlike in tableau - my dreaded containers.
I was using sample superstore to play around with in Power Bi.
I wanted to create a map that shows the states with the profitability and unprofitability - the issue I came across was creating a calculated field.
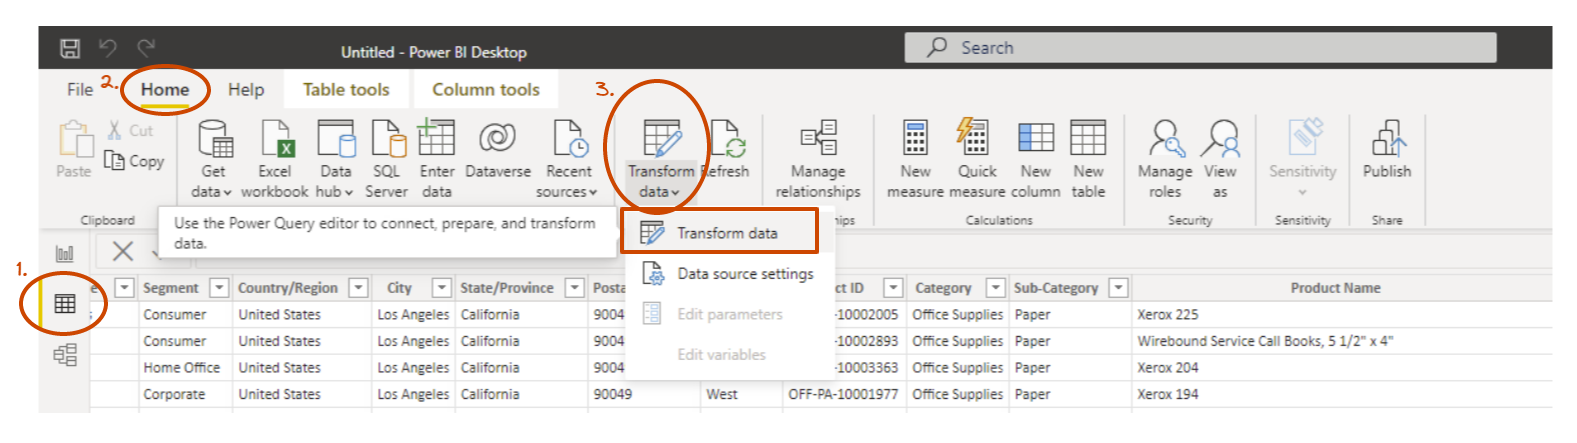
How to create a calculated field:
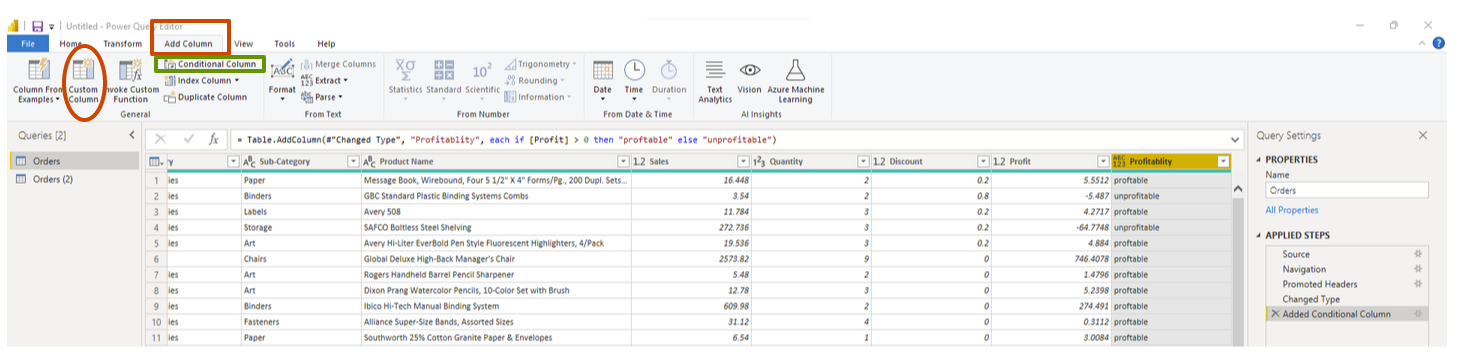
You need to create a new column in the dataset - to do so:
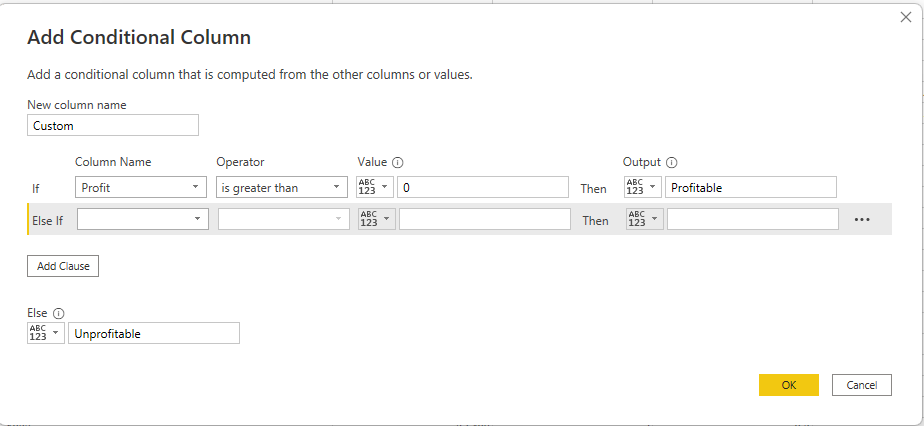
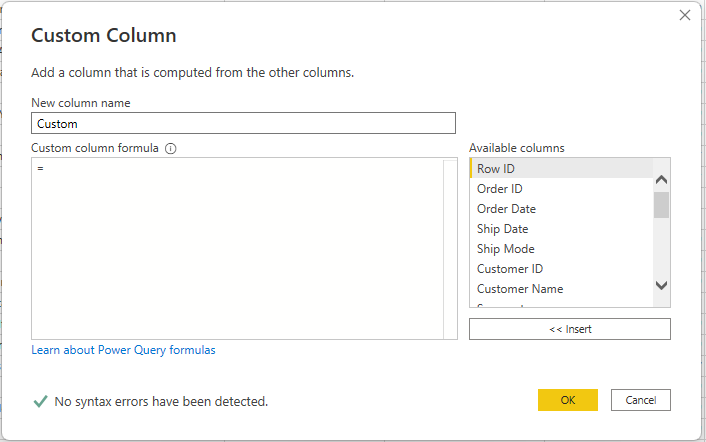
A new window will pop up: This is where you will create your new column.
Conditional Statements:
Any other Calculations:
Once you have hit 'OK'
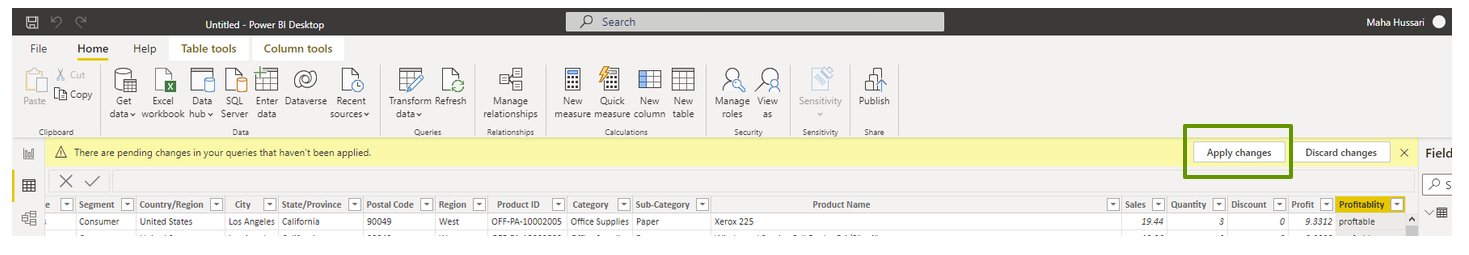
Go back to the original window of Power Bi and this yellow banner will appear. Hit Apply changes -> the new column will appear in the right hand field pane which you can now use