


As part of a Preppin' Data challenge I did last week I had to make a running sum in Tableau Prep. Figuring that out gave me a little bit of a headache (and lots of sketching of tables).
This week, DS 40 have been learning how to use Alteryx to prepare a data set. As soon as I saw the Running Total tool my eyes lit up. Lets use it below.
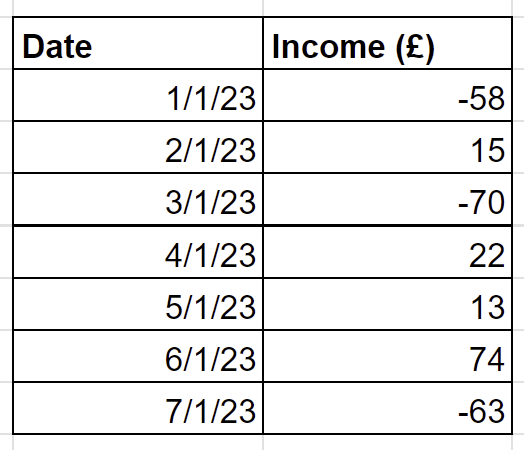
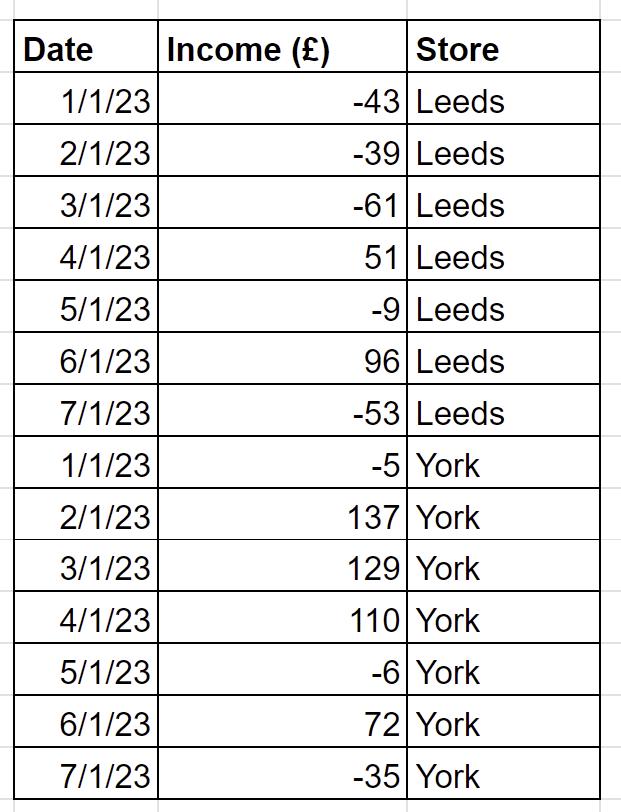
Here's the data on which we want to perform a running sum:
And here's my Alteryx workflow:
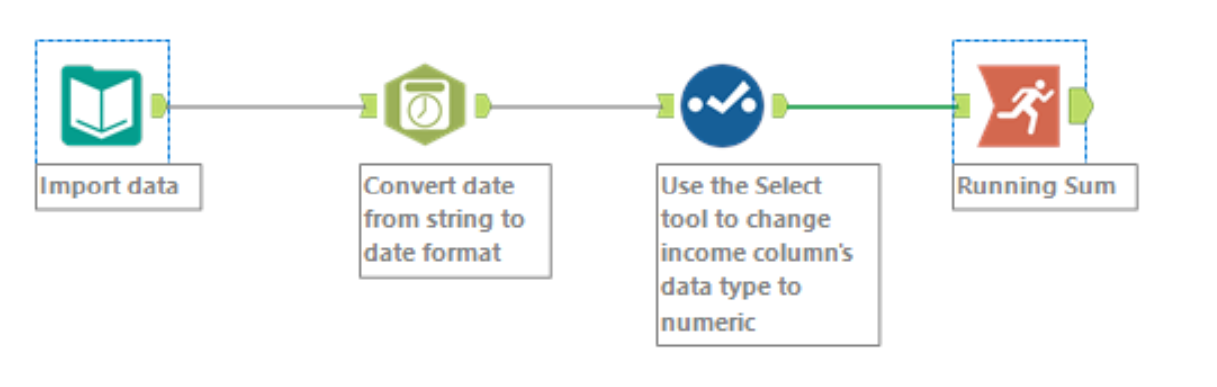
Import the data
Use the DateTime tool from the Parse area to convert the dates into a datetime format
Use a Select tool from the Preperation are to clean the data so its ready for the running sum. I had to unselect my original date column, change the name of the income column and change the income column to type Int64 (but Int8 probably would have been better)
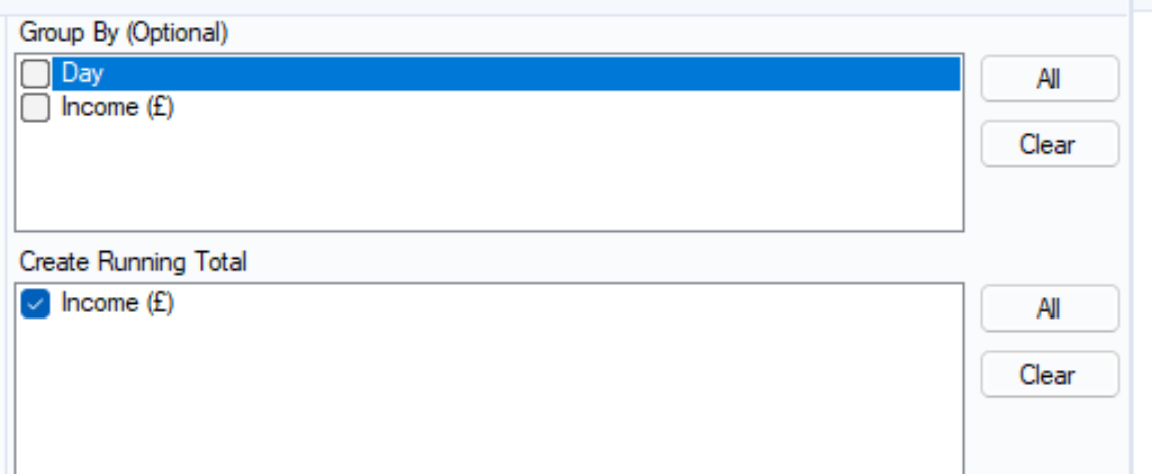
Use a Running Sum tool from the Transform area. Make sure nothing is selected in the upper 'Group By' panel, and select the income column in the lower 'Create Running Total' panel
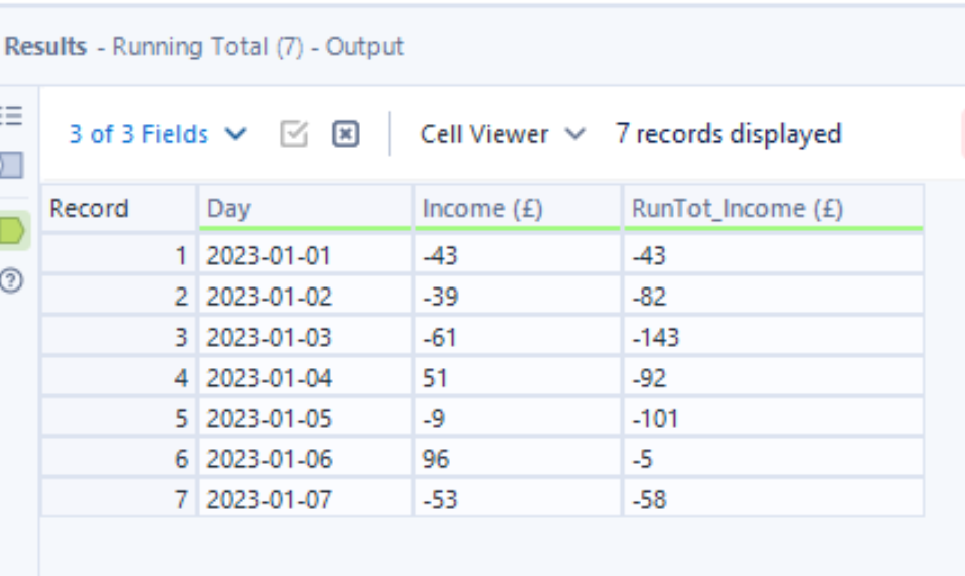
Here's my outcome, which matches up nicely with the Prep version:
This simpler method means we can more easily complete more complex running sums. Below is a similar dataset to the above, but this time with an additional column for the store. How can we find the running sum for each store?
If I were to do this in Tableau Prep I would need to sit down and think about it for quite a while, but the Alteryx tool simplifies the process.
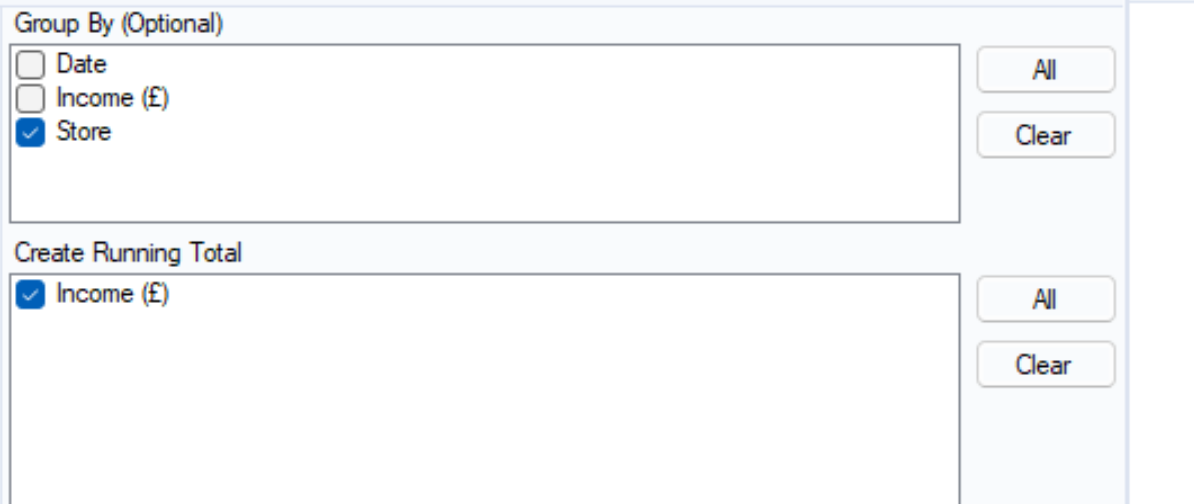
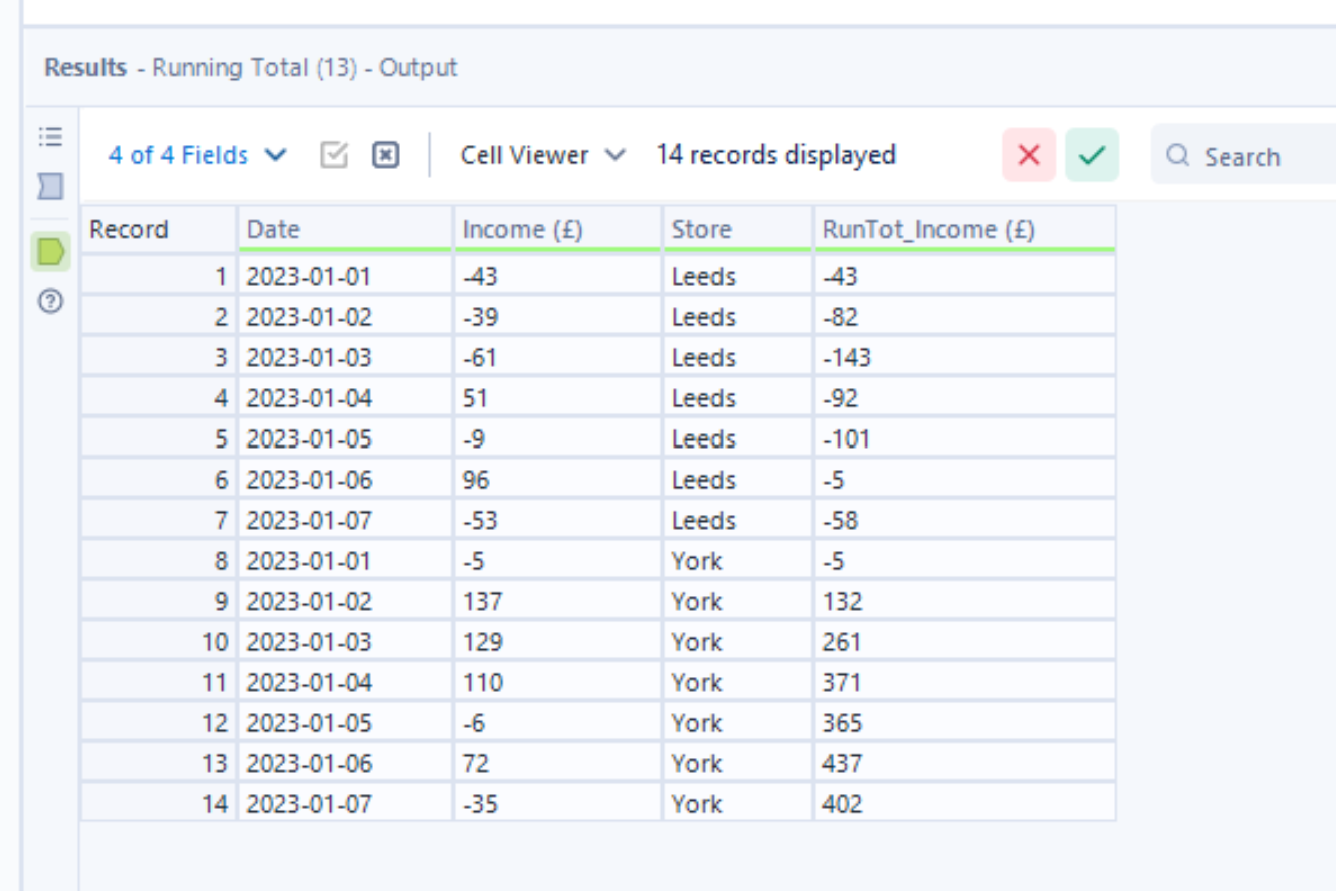
We can use the upper 'Group By' panel in the Running Total configuration to calculate by Store - see above. This time, we'll make sure that the store column is selected here. After runbning the workflow, we will get the below output.
If you've made it this far, here are some tips I've found useful over the past two days.
- When you add a Formula tool, you NEED to select which column the calculation should be applied to, whether that be a pre-existing column or a new one
- The Summarize tool can be used similarly to the Aggregate tool in Tableau Prep. The string actions can be really useful - I've used it to concatenate the name of every holiday for different countries
- The Multi-Row Formula tool in the Preparation area can be used to fill in empty rows - the row before or after can be used to derive the value