


Level of detail calculations (LODs) are simply a calculation that allows us to calculate data at different level of detail (very insightful). What breaks down this explanation is understanding that the level of detail is set by different dimensions, i.e. the Tableau blue pills. So an LOD basically aggregates the data at the level set by your dimension.
Lets work through an easy example to understand this better. Say I want to understand how many customers made one, two, three orders etc. This means I would have to break up the view by the number of customers who made different amounts of orders - and as you guessed it, it's hard t break up a view with a measure, because the level of detail view, as mentioned, is broken up by dimensions.
Luckily, an LOD can fix this. Lets create it and break it down.
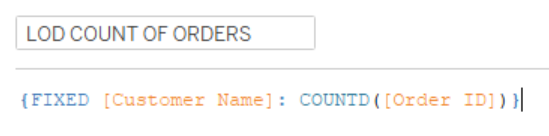
{} - These curly brackets mean an LOD is happening. Anytime you see them, just remember the calculation is an LOD.
FIXED - This expression can produce either measures or dimensions, depending on the type of field used in the aggregate expression. For example, {FIXED: SUM([SALES]) will result in a measure because [SALES] is a measure. However in our example, [ORDER ID], it will be a dimension, because [ORDER ID] is a dimension. If a FIXED LOD expression is saved as a measure, you can choose to move it to the dimensions category.
[CUSTOMER NAME] - The dimension used to define this level of granularity. This means that the calculation will produce one result for each unique customer name.
COUNTD - This is Count Distinct. This aggregation function avoids double-counting if a customer has multiple orders with the same [ORDER ID].
Building the Viz
Now that we have our LOD calculation ready, we can build our visualisation to show us how many customers placed an N amount of orders. First lets start by bringing [CUSTOMER NAME] or [CUSTOMER ID], depending on which dataset you are using, into the rows column.
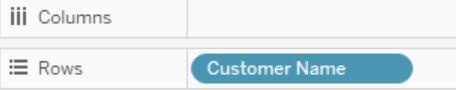
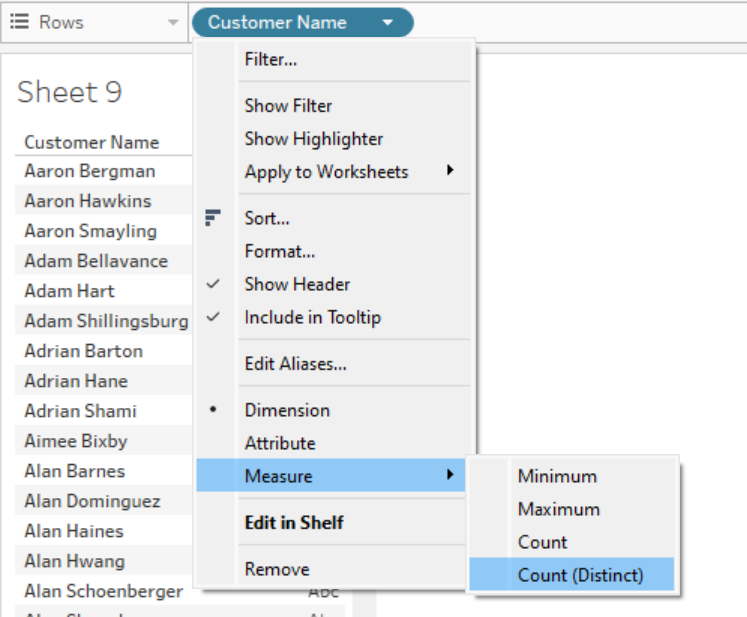
As you can see, its a dimension, which just returns a long list of names. By hovering on the pill, and left clicking the little arrow pointing down. Then go down to measure, and select COUNT(DISTINCT). This will then count all the distinct customers, instead of all the repeats who have made multiple orders.
Now you've probably noticed your pill turn into a measure! Next, we will drag our LOD calc into the column card, to help us split the view by the different numbers of orders placed by 1 customer. Your bar chart should look something like this (again, depending on what dataset you are using).
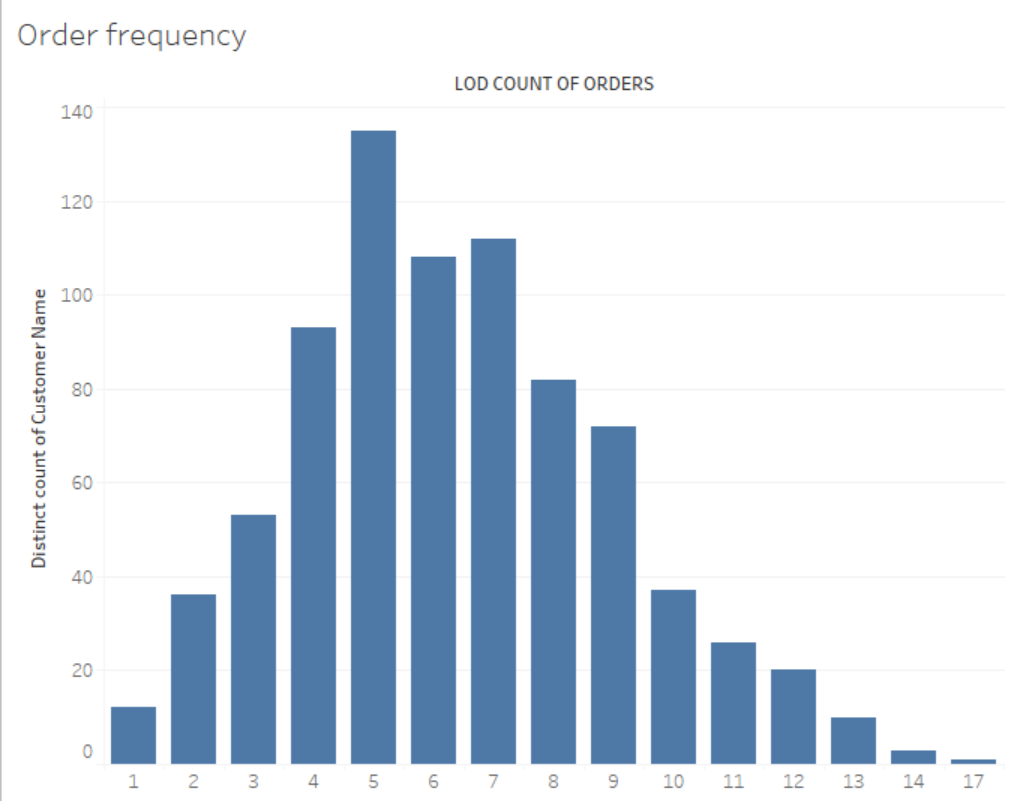
Now for clarity purposes, lets drag the COUNTD[CUSTOMER NAME] calculation onto the label card so we have a better read of what each bar says.
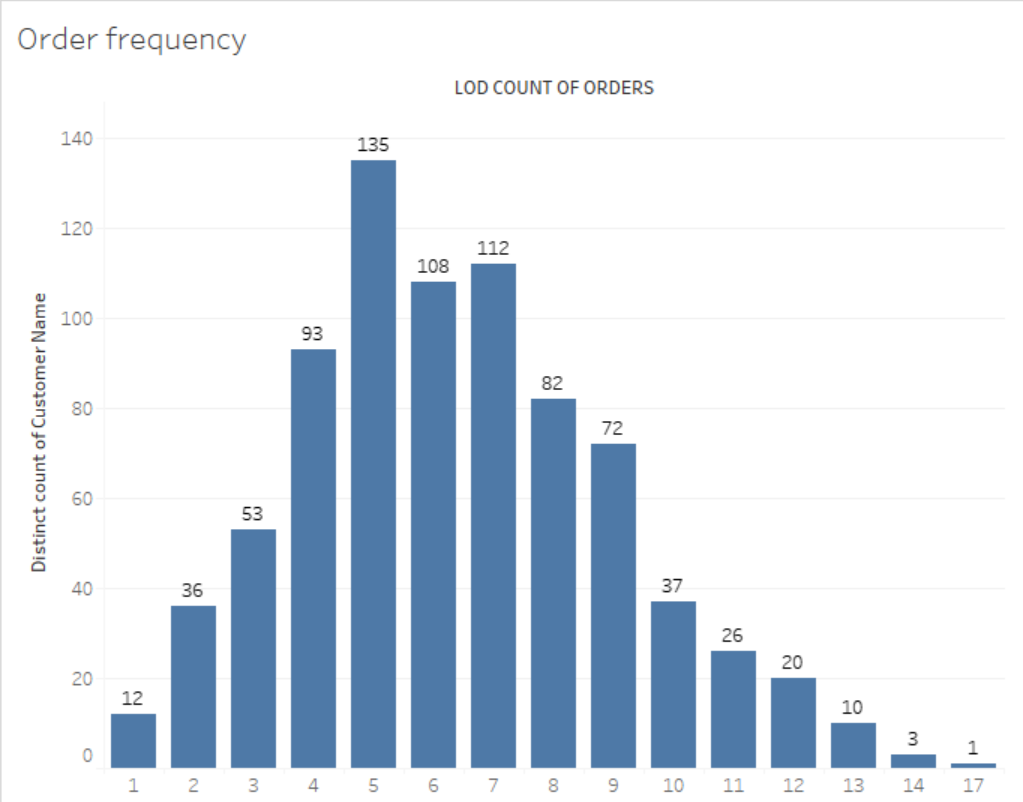
And there you have it! Now we can see that actually 135 customers have placed a total of 5 orders 😄.