Today's Dashboard Week challenge was to create a dashboard using US Census data related to tobacco use. The first challenge I faced was handling the .dat file format the data came in. After some experimentation, I set the Input Data tool in Alteryx to read the file as a fixed width, with a width of 701 characters (the maximum number of total characters in one record). This allowed Alteryx to read in all the data from each record into a single cell. However, since each record contained responses to around 200 census questions, it required a lot of manual work to extract the relevant data from each field. Given our limited time, I focused on a few basic demographic fields along with some fields related to tobacco usage.
I used substring formulas to break apart the relevant fields, then ended up using chat GPT to write my if statements after copy and pasting the different codes from the data dictionary.
Once I had cleaned and processed the data, I output it as a .hyper file for use in Tableau.
My workflow is below:

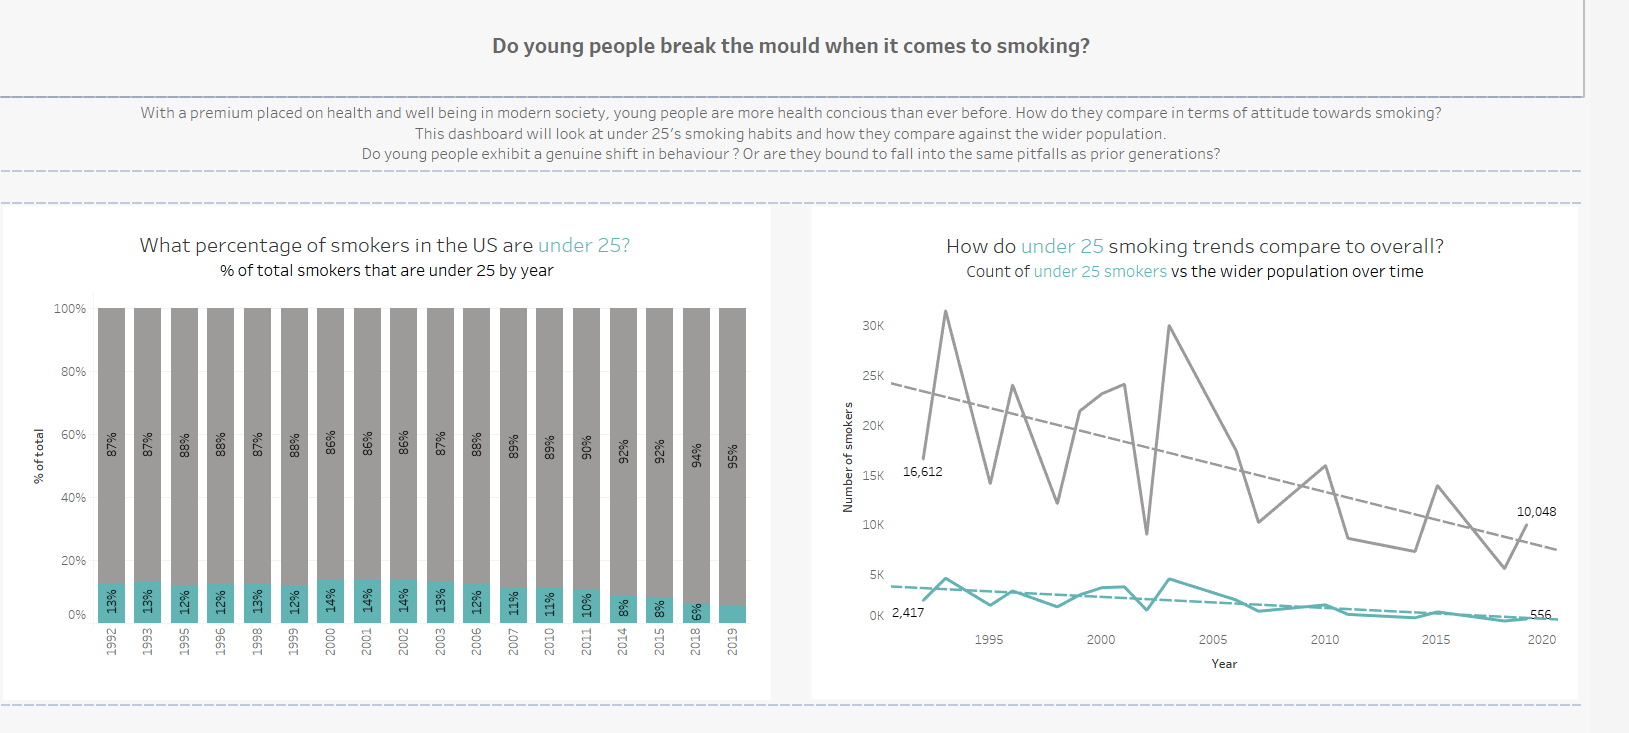
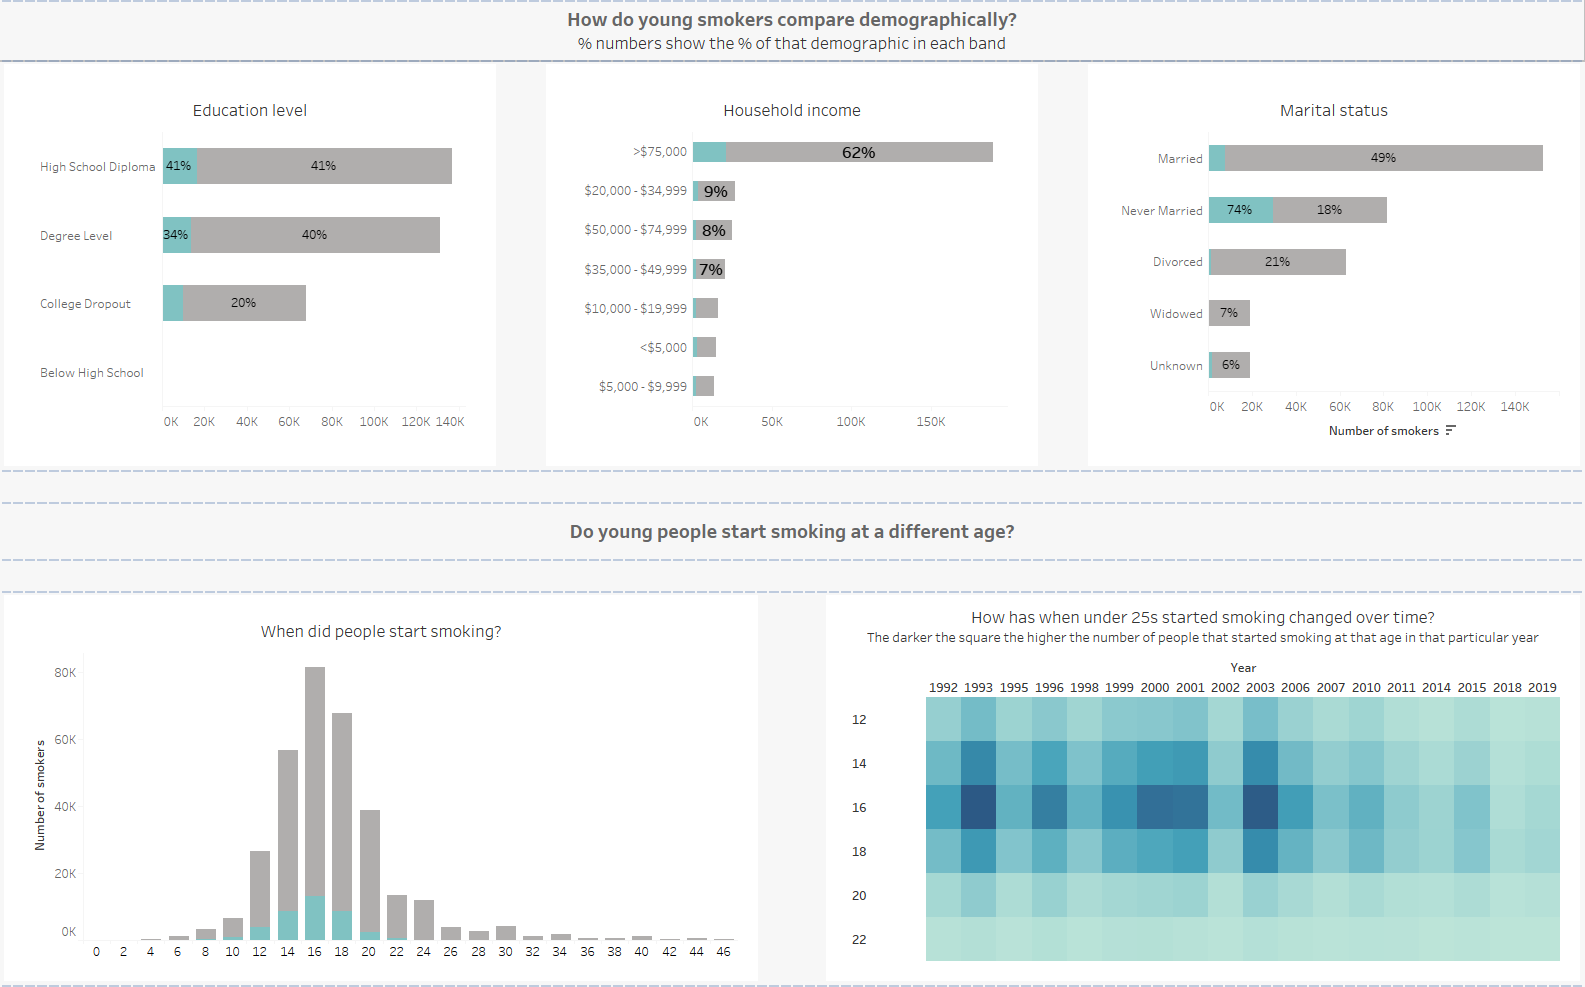
After eventually getting the data into tableau, I decided to focus on young people and their smoking habits. I wanted to compare the U25 demographic vs the wider population to see how trends compared as well as general population factors. I decided to look at the % of total smokers that u25s made up every year, which stayed relatively the same throughout. I checked general trends in terms of the number of U25 smokers vs those above the age demographic. I then looked into how U25 smokers compared in terms of education, household income and marital status. The only one of these that saw a large divergence was marital status, as you’d expect. Young people are less likely to be married than the older generations.
The last thing I looked at was the age people started smoking but once again there weren’t many obvious interesting trends.
The main feedback I received on my dashboard was to try and tell the story throughout. The main question I posed was ‘Do young people break the mould when it comes to smoking?’ but then concluded that they follow a similar trend to the population at large. Instead I should have led with the fact that young people are following similar trends to the wider population and tried to tell that story throughout my dashboard.
You can see my final dashboard below: