The final day of dashboard week has arrived, but it has not been very friendly.
It does make sense that the last day would be the toughest, and today definitely came with some challenges.
The Brief
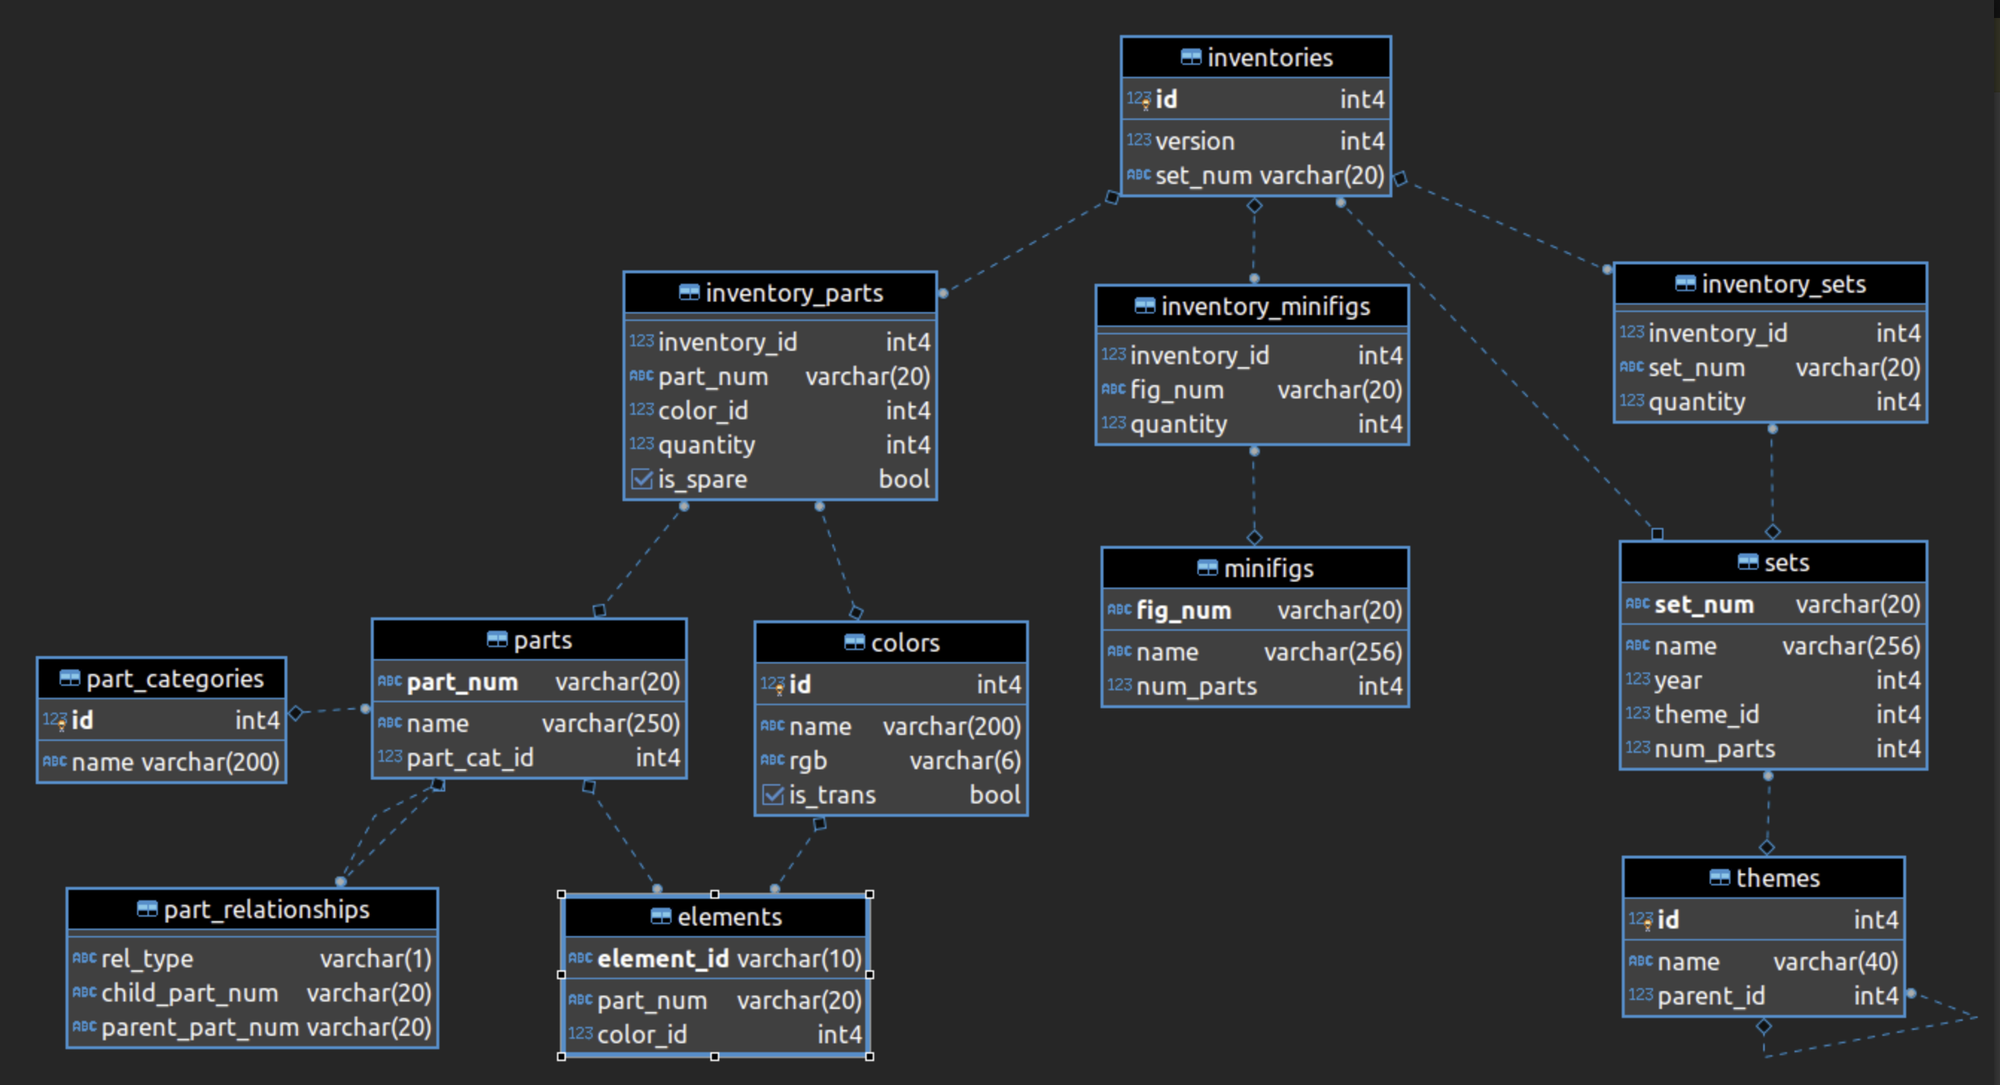
We got provided with 12 tables all to do with lego sets. Our goal was to take this data and transfer it into snowflake, making our own schemas and cleaning it with SQL.
The main aim was to delve into the data and choose a summer theme - e.g. beach lego sets, or holiday lego sets, and produce a dashboard based on what we could extract with SQL.
We were provided with the following schema for how "all" the data should be laid out. We obviously didn't need all this data for our summer dashboards, so we had to decide what was important to keep, and how we can relate this kept data together.
The Process
I started off by just delving into the data in Snowflake, selecting everything so that I could view all the data in each table.
I decided that my summer theme would be "surfing" - so I would need to filter all the data to include lego sets that included the word "surf" within them.
I quickly realised that the only data I needed was from the sets, themes, inventories, minfigs, inventory_parts, and colours tables. The next step was deciding how I was going to extract this and then link them all together.
Just by looking at the schema you can see it's split up into 3 "streams", so my plan was to create 3 different views:
- Sets + Themes
- MinFigs
- Parts + Colours
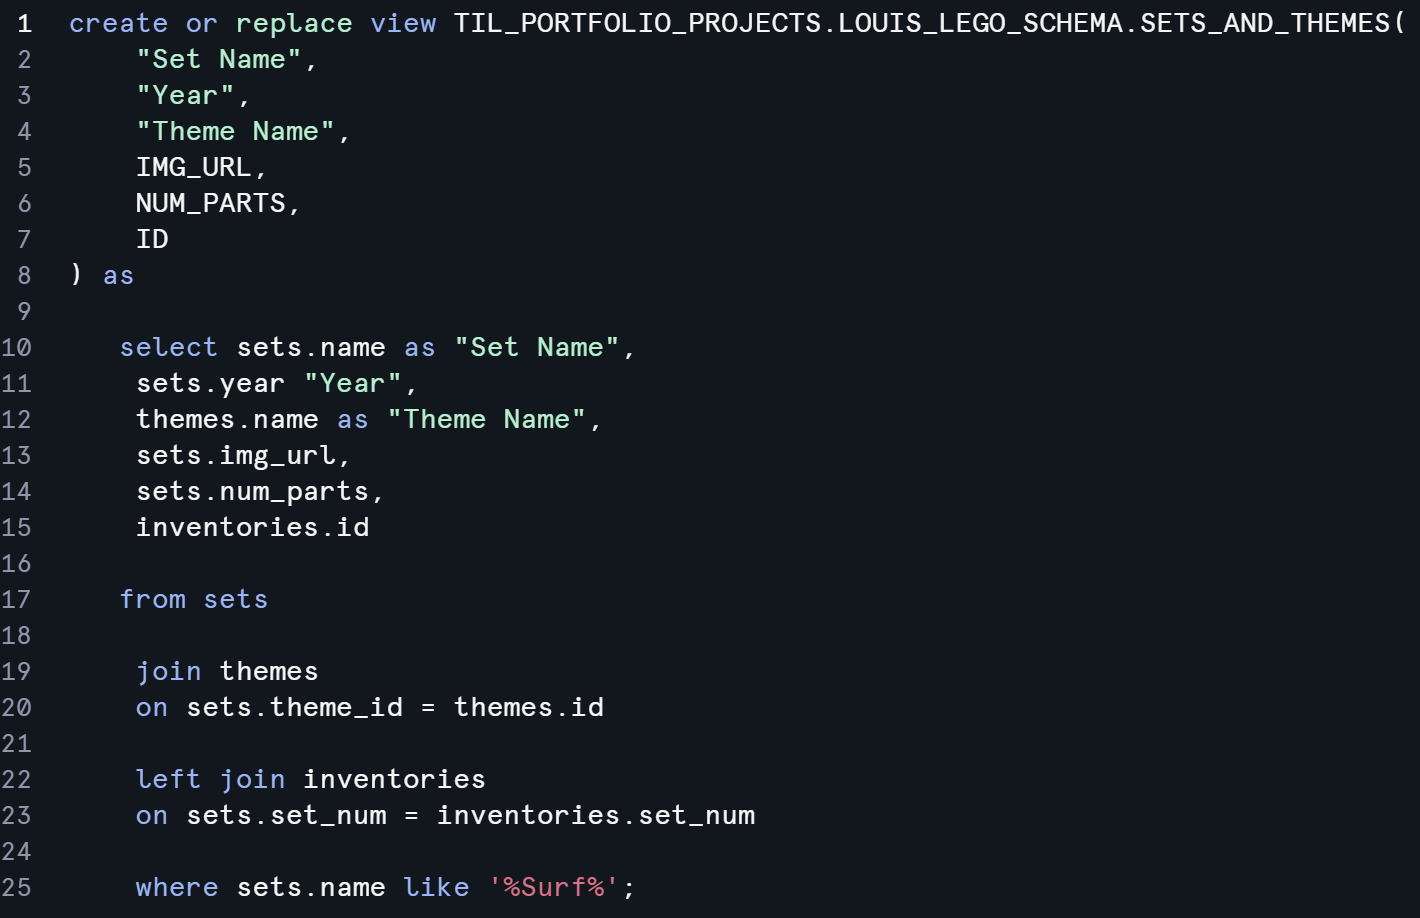
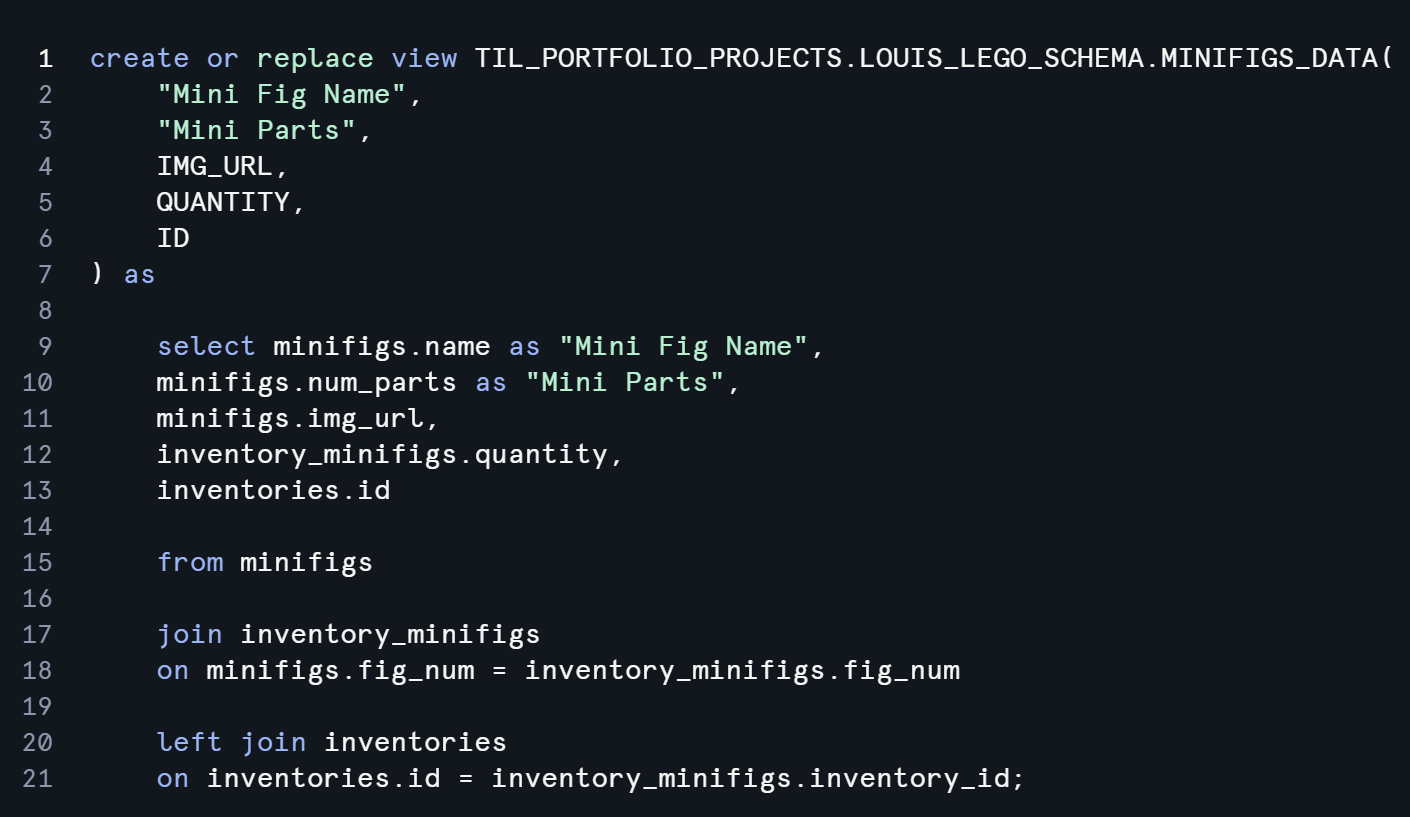
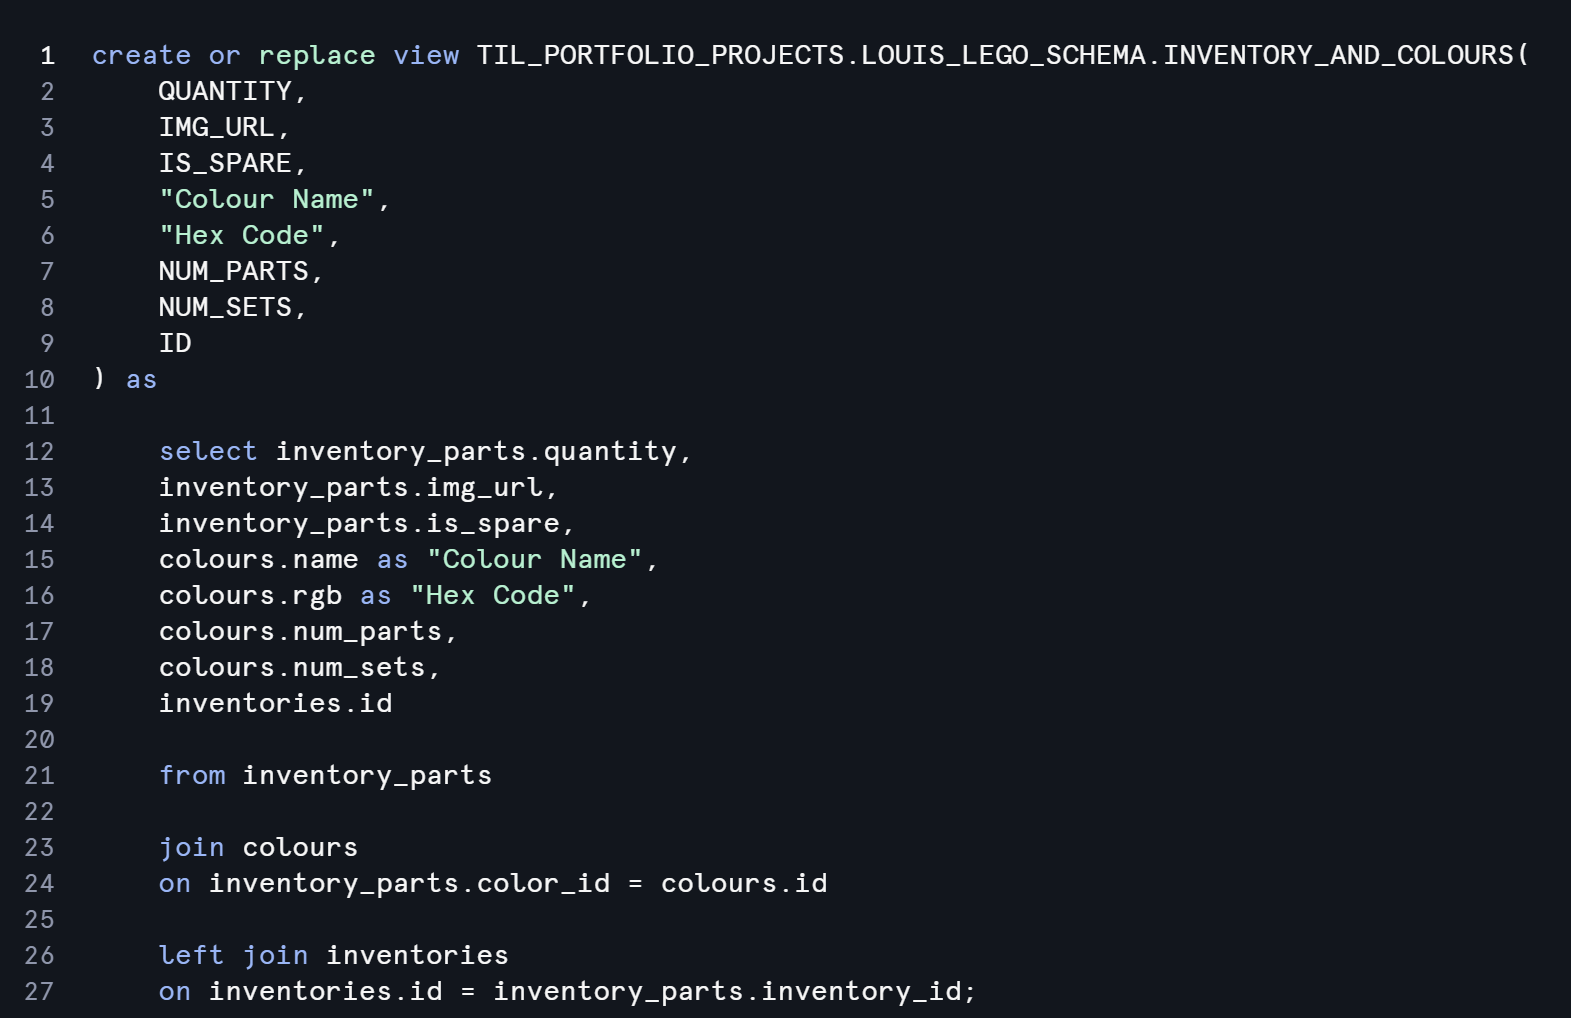
Below are the SQL scripts I wrote to create the 3 views.
Once I had these 3 views created, the next thing to do was import it into PowerBI.
This presented one of the more annoying challenges of the day. Entering data into PowerBI straight from Snowflake is not that difficult, yet it took ages to do it. Things going wrong with the interface, login detail problems, and getting a load of unexpected errors turned this into a problem, but we got there in the end!
Once I had my 3 tables in PowerBI, I set up the data model:
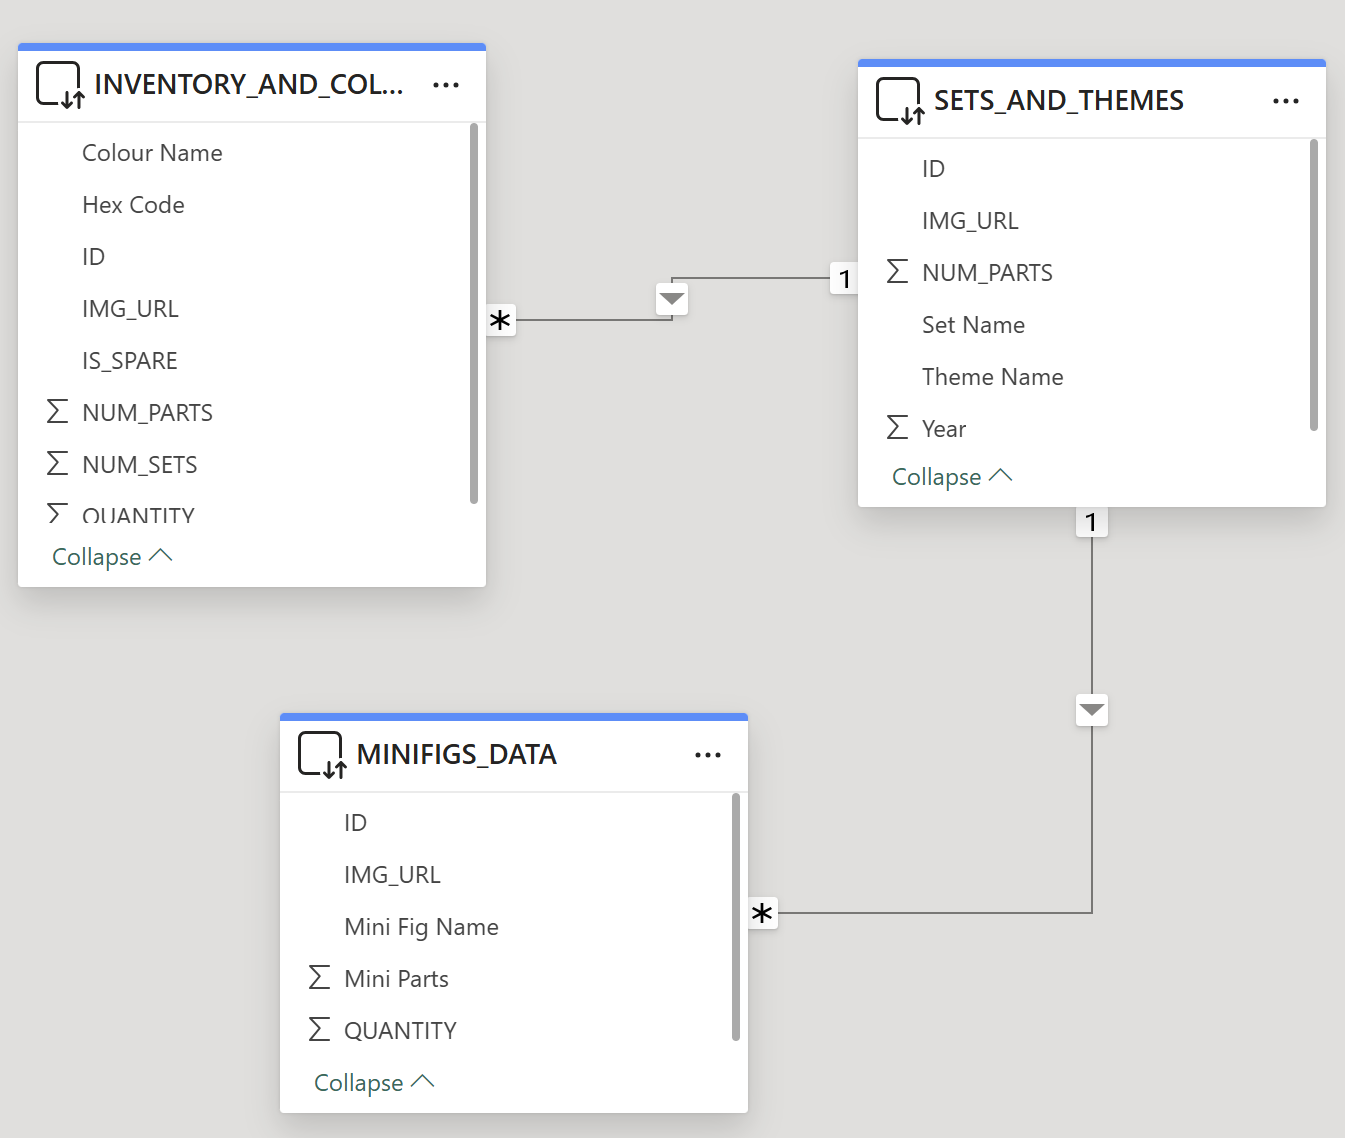
Everything was linked using the "Inventory ID" which I had purposely kept in each view so that they could speak to eachother in PowerBI. The "Sets & Themes" table was my fact table and I had a cardinality of one to many coming out of it.
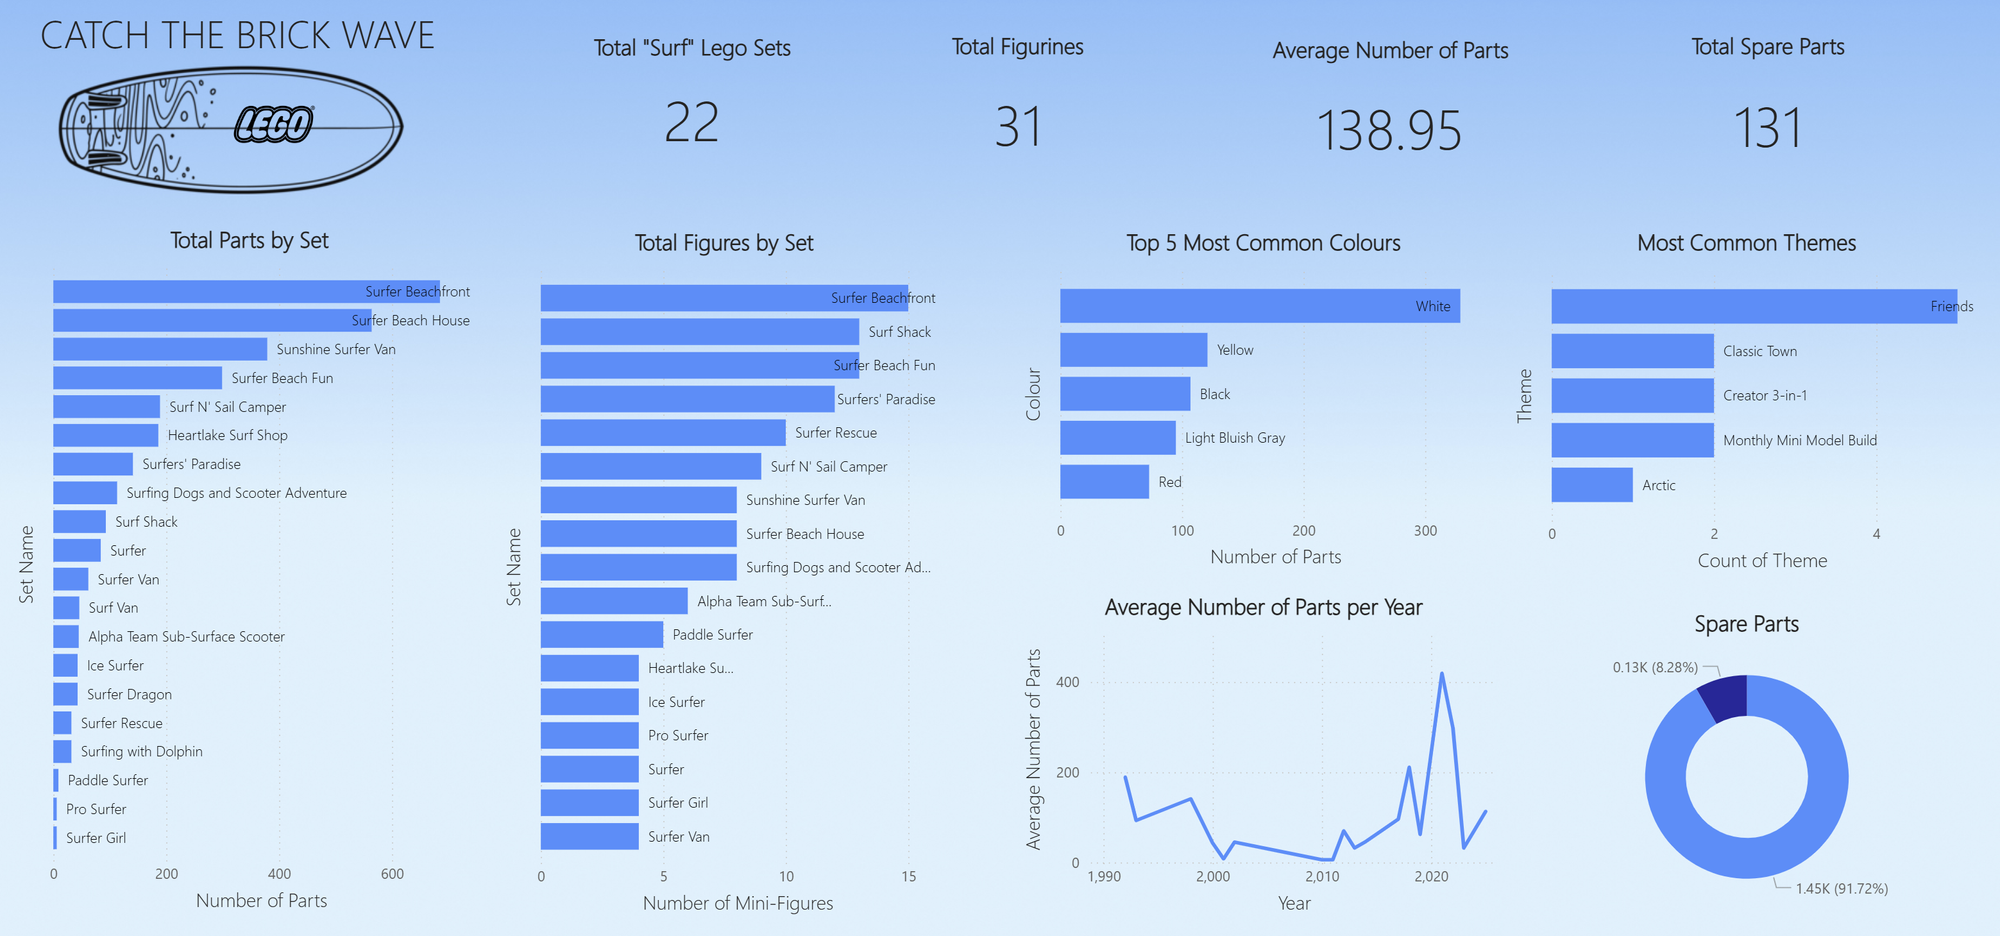
Once I had reached this point I only had an hour and a half to cook up a dashboard. I spent most of the day refreshing on Snowflake and SQL - not knowing how to fully start the project really hindered my actual ouput!
Even with all the struggles, I definitely learnt a lot about Snowflake and SQL today.
This was my final dashboard (not my proudest!)