


In the previous blog, I shared the differences in using GROUP BY and shifting rows across three platforms: SQL, Python, and Tableau.
Another common technique when working with data is pivoting. In some cases, pivoting data from rows to columns is useful, while in other situations, transforming columns to rows makes more sense.
In this blog, we'll explore when to apply pivoting and compare how it's done across SQL, Python, and Tableau.
If you're ready, let's dive in!
1/ When to apply pivoting data?
Pivoting data is a technique used to rearrange rows and columns. It typically involves:
- Rows → Columns (Pivot or Cross Tab in Alteryx), also known as transforming from long to wide format
- Columns → Rows (Unpivot, Melt, or Transpose in Alteryx), also known as going from wide to long format
Depending on your goal, the structure of the data, and how you plan to analyze or visualize it, you can choose either approach.
a) When to pivot data (from Rows to Columns)?
If you want to compare values side by side or summarize data for reporting, pivoting (i.e., transforming from rows to columns) is a great approach.
Example:
I have a table with three columns: Region, Year, and Sales. (See the left side of Fig. 1.)
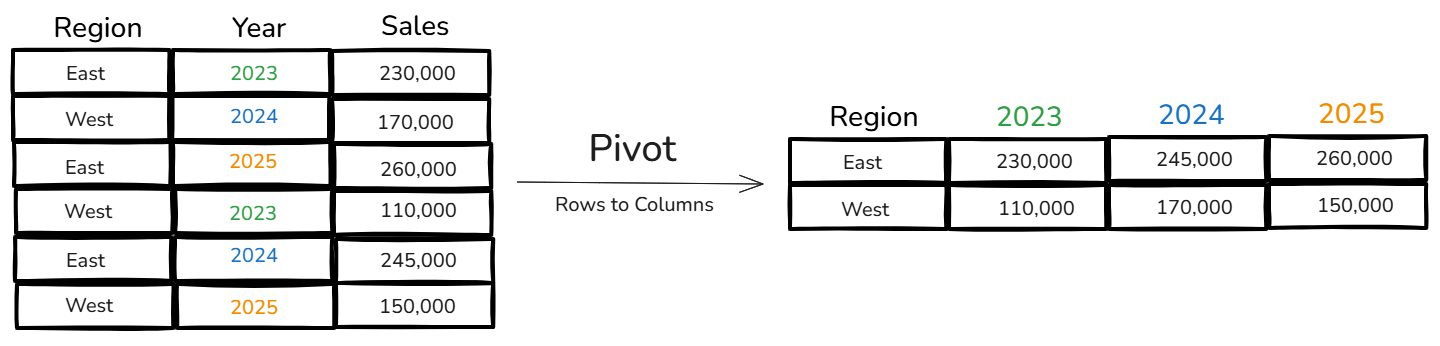
Now, ask yourself:
- Can you calculate the total sales for each region?
- Can you compare sales by year for each region?
- Can you find the total sales per year?
Looking only at the left table, it’s a bit tricky to answer these questions. But if you check the right table in Fig. 1, it's much easier:
- Each row represents a region, making it easy to sum up regional totals.
- Each year is a column, allowing side-by-side comparison.
- You can quickly compute annual totals by summing across rows or columns.
b) When to unpivot data (from Columns to Rows)?
In some tools (like SQL or pandas), working with long-form data (rows) is more efficient. Similarly, in BI tools like Tableau or Power BI, row-level granularity allows for better visualizations and dynamic dashboards using metric parameters.
For example:
I have a table with the following columns: Order Date, Furniture, Office Supplies, and Technology (Fig. 2, left table).
To build a line chart comparing sales trends for each category, I need to unpivot the table (Fig. 2, right).
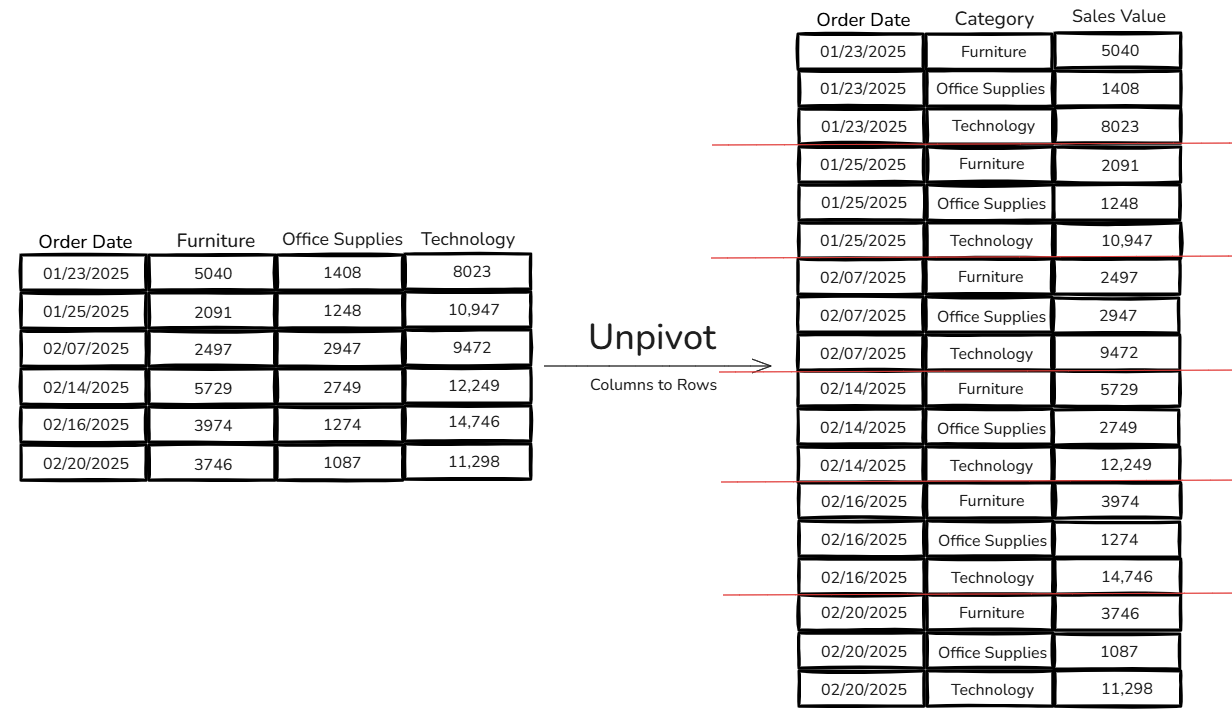
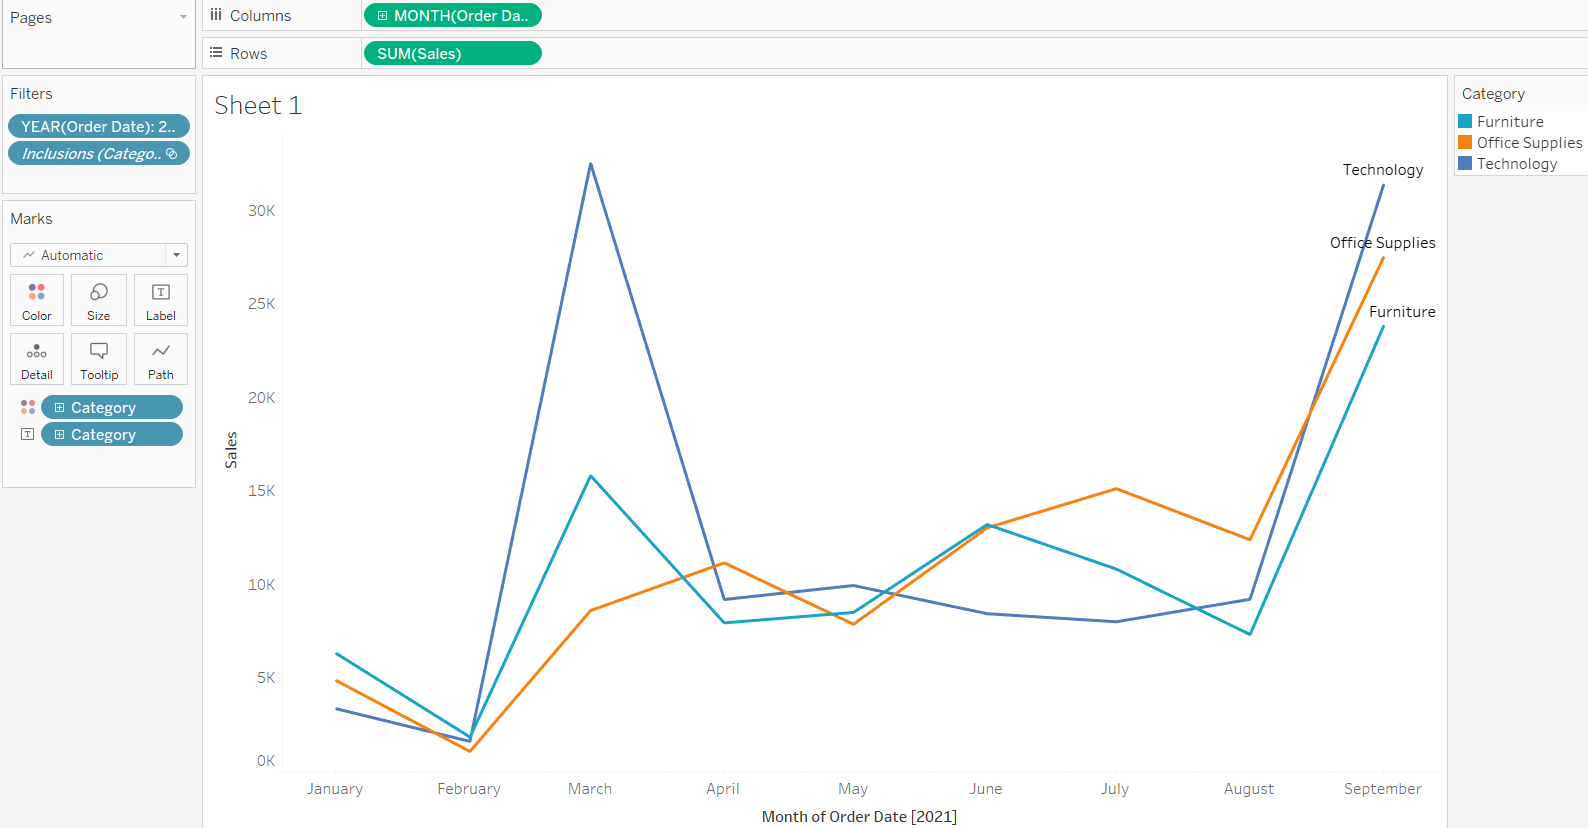
After unpivoting, I can easily build a dynamic line chart in Tableau:
- Drag Sales Values to Rows
- Drag Order Date to Columns
- Add Category to Label and Color
You’ll end up with a line chart like Fig. 3, showing clear trends for each category.
2/ Pivot/ Unpivot in SQL
a) Pivot data from Rows to Columns:
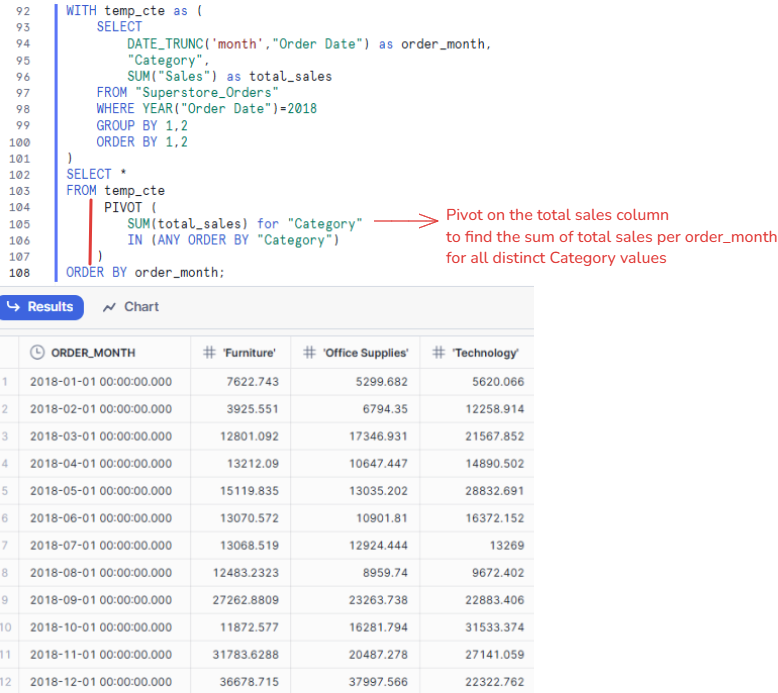
Let’s say I have a table with Order Month, Category, and Total Sales. I want to transform it to show each category in a separate column.
Here’s how I can write the SQL query in Snowflake:
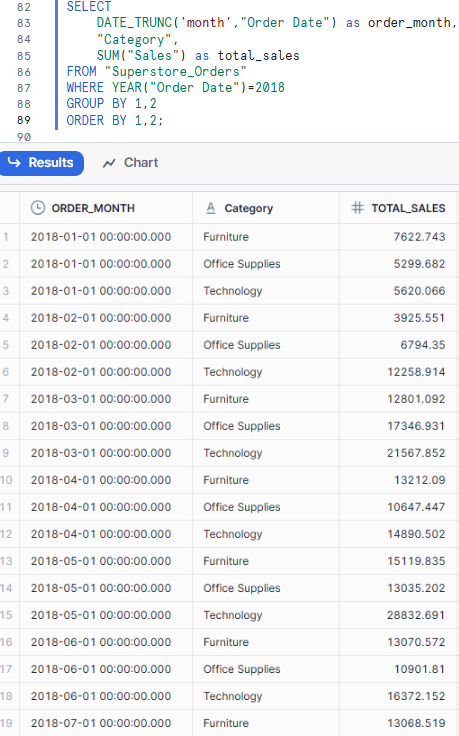
From that table, I would like to pivot data from rows to columns. So, I would like to see the total sales of each category in a separate column. I will put the SQL query above in a CTE and write another query from that CTE:
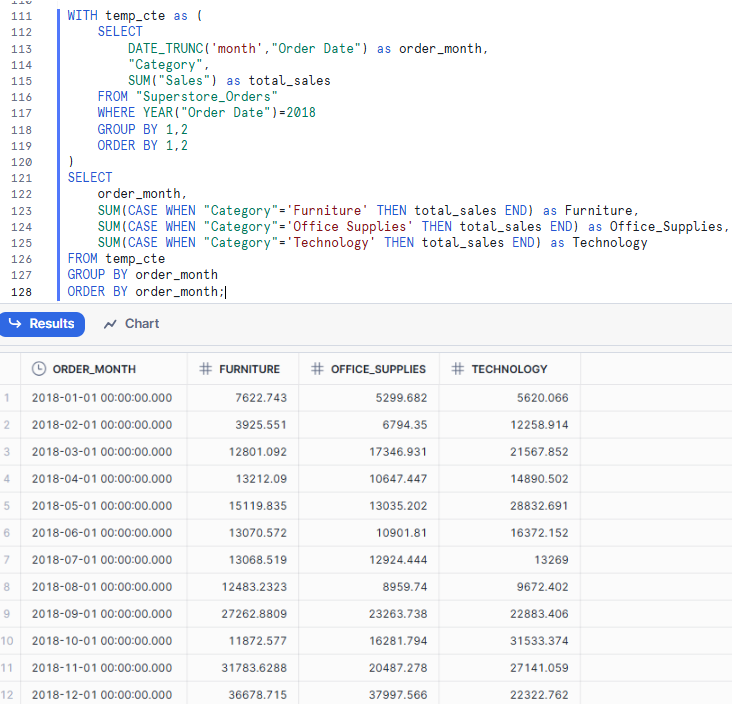
Alternatively, you can use CASE WHEN to pivot, although this approach is less scalable when the number of distinct values is large.
On the Snowflake documentation page, there are some dynamic ways to pivot data. You can read it here.
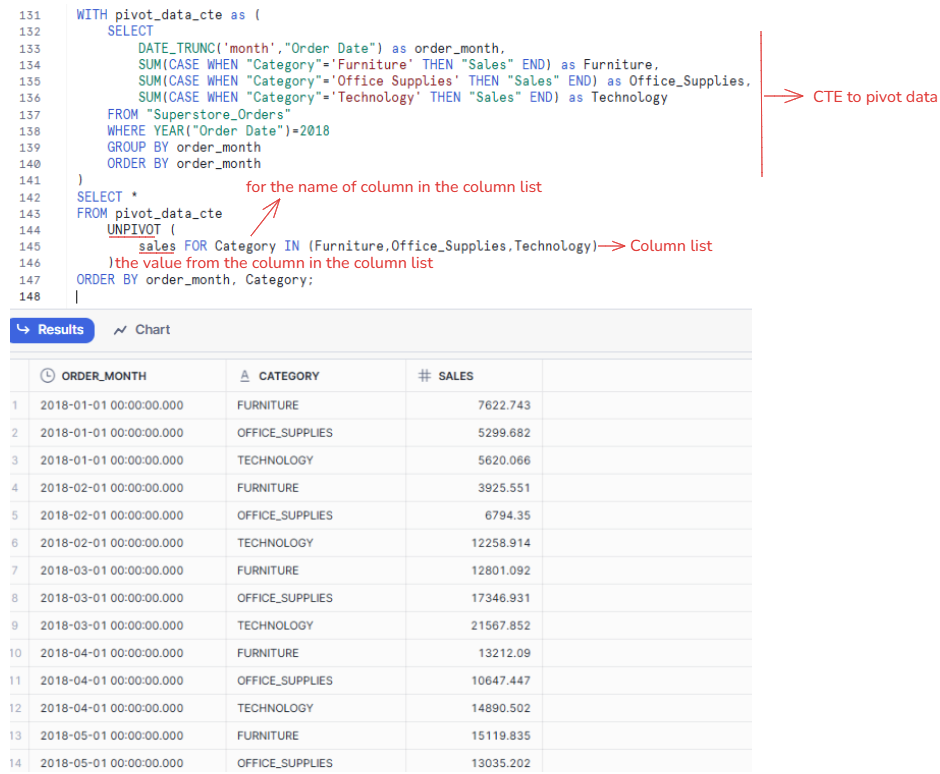
b) Unpivot data from Columns to Rows:
From Fig. 6 above, I already pivoted the data containing 4 columns (Order_Month, Furniture, Office_Supplies, Technology). I will put that SQL query in a CTE called pivot_data_cte. Then, I write a query from that CTE to unpivot data with the function UNPIVOT().
The syntax of UNPIVOT from the Snowflake documentation page is:
SELECT ...
FROM ...
UNPIVOT [ { INCLUDE | EXCLUDE } NULLS ]
( <value_column>
FOR <name_column> IN ( <column_list> ) )
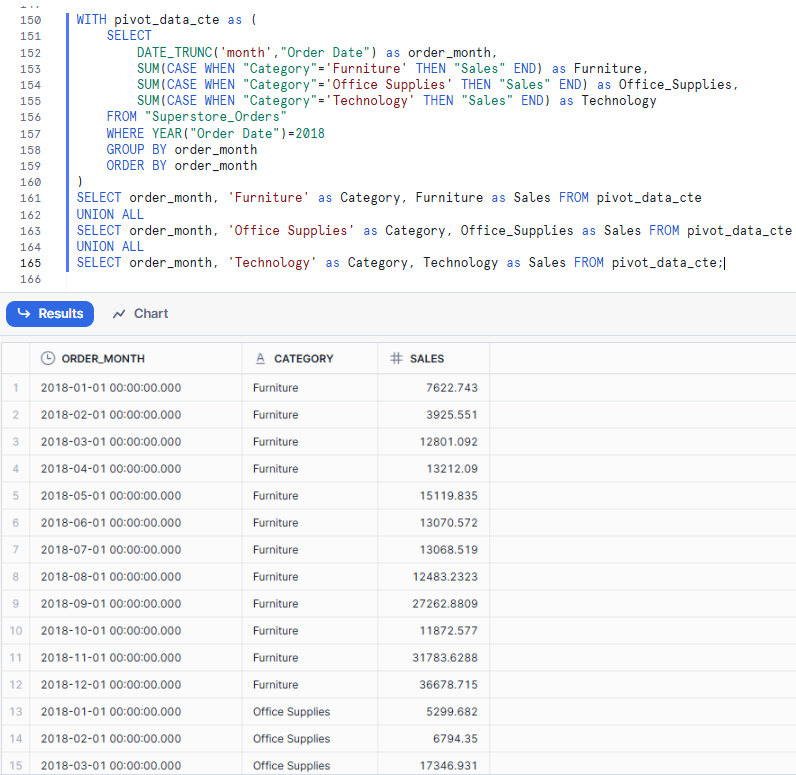
Another way to unpivot is by using UNION ALL, especially if the number of columns is manageable. You can write separate SELECT statements for each column and stack them vertically:
This blog is quite long, so I’ve split it into two parts.
In Part 1, I explain what pivoting and unpivoting data means, when to use each (pivot: rows to columns; unpivot: columns to rows), and how to perform these transformations in Snowflake, with practical examples. I hope this helps you when working on data manipulation tasks.
In Part 2, I’ll show how to pivot and unpivot data in Python and Tableau Desktop.
Hope to see you soon!