As part of todays task, I built a heatmap with data on penguins and seals in Antarctica.
In order to build a heatmap, you first need to pick a data set. This data set must have a latitude, longitude and numeric column. For example this data has the latitude and longitude of the animal's location and a count of how many animals live in that general area.
After picking your data, you must import it into Alteryx (either by dragging from your files or using the import tool). Next we need to create individual points for each animal group using the 'create points' tool.

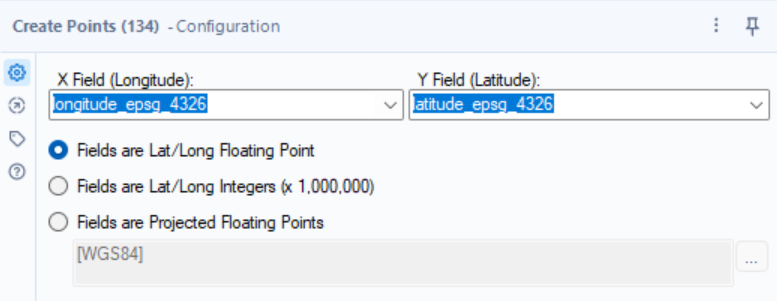
Where the X Field is the longitude value in your data, and the Y field is the latitude value. Check your latitude and longitude values, and see which of the three points below best fit your values.
Next you have to check your numeric data, if it is already a 'double' data type then we are ready to create a heatmap and you can ignore the next paragraph.
If the numeric data is a string or non numeric data type, you should use the select tool to change it into a double data type, using the 'Type' columns dropdown menu.
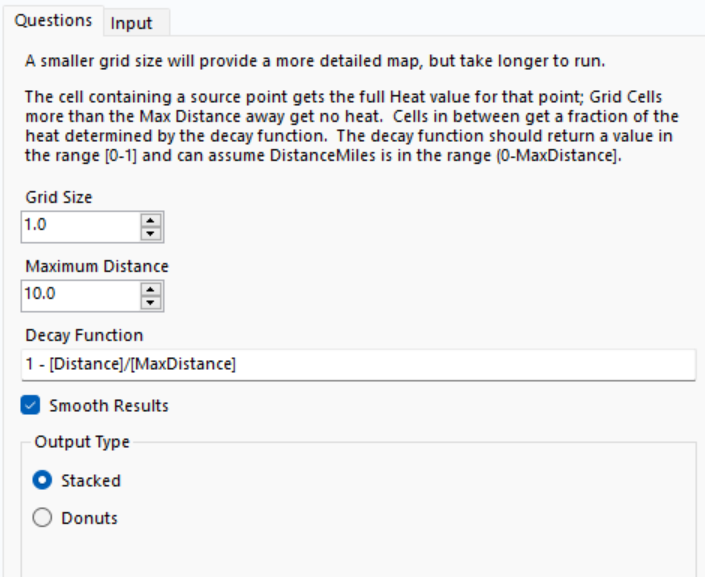
Now we can finally use the heatmap tool. You will start by seeing this in the left pane:

- The grid size affects how detailed the map should appear.
- The maximum distance is the furthest from the middle point, the heat bubble should reach.
- The decay function determines how the 'heat' sections of the heat map should appear and how quickly they should fade.
- Smooth results if ticked, gives nice rounded bubbles, however, when unticked, gives jagged edges showing each part of the grid.
- Donuts have a single heat value, compared to stacked, with stacks all heat values in the area. In my example, I used stacked.
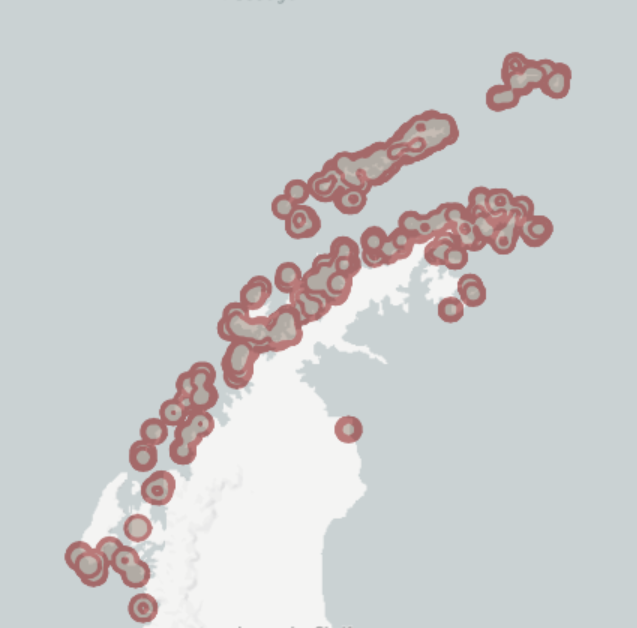
If we put a browse tool onto our workflow, you can visualise your heatmap.

However, this does not have the gradient, people tend to associate with a heatmap, so let's try importing it into Tableau and see how it improves our visualisation.
So let us export this using the 'Output data' tool into a Tableau Hyper file, to visualise it better in Tableau.
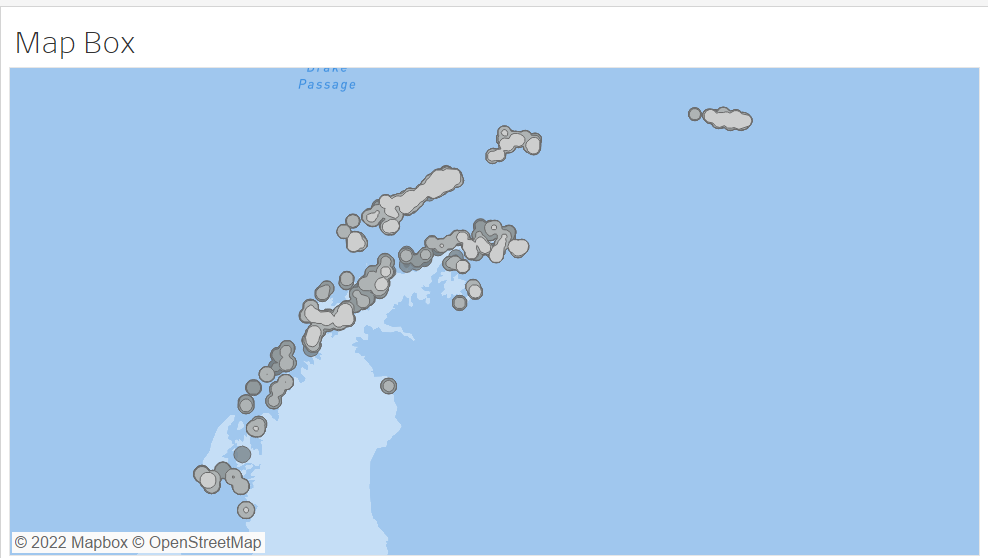
After importing our exported file into Tableau you can now double click 'spacial object' and see your heat map brought to life with the magic to Tableau and Alteryx.

