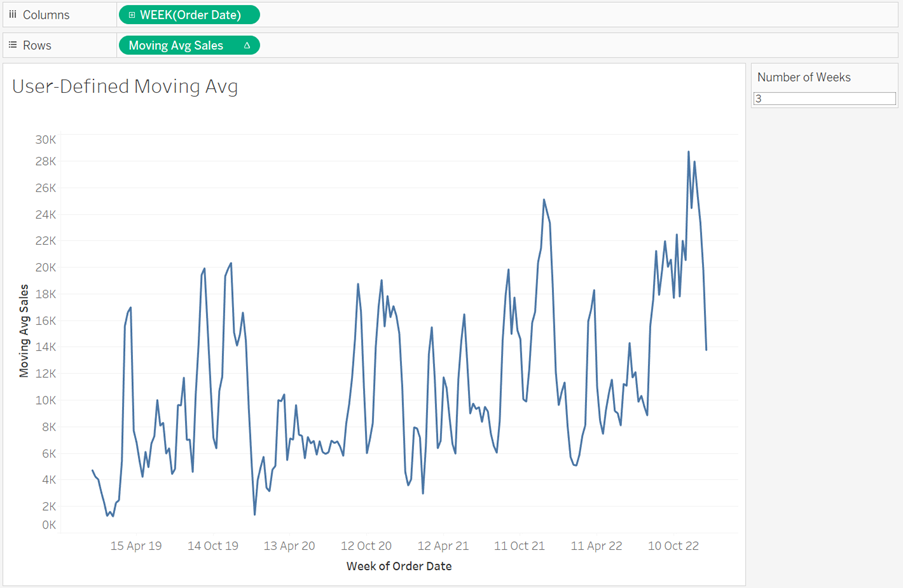
Lets say you want to show a moving average on a line chart in tableau where you are able to change the number of days.
Let us use the superstore data set to make it simple and you too can have a go.
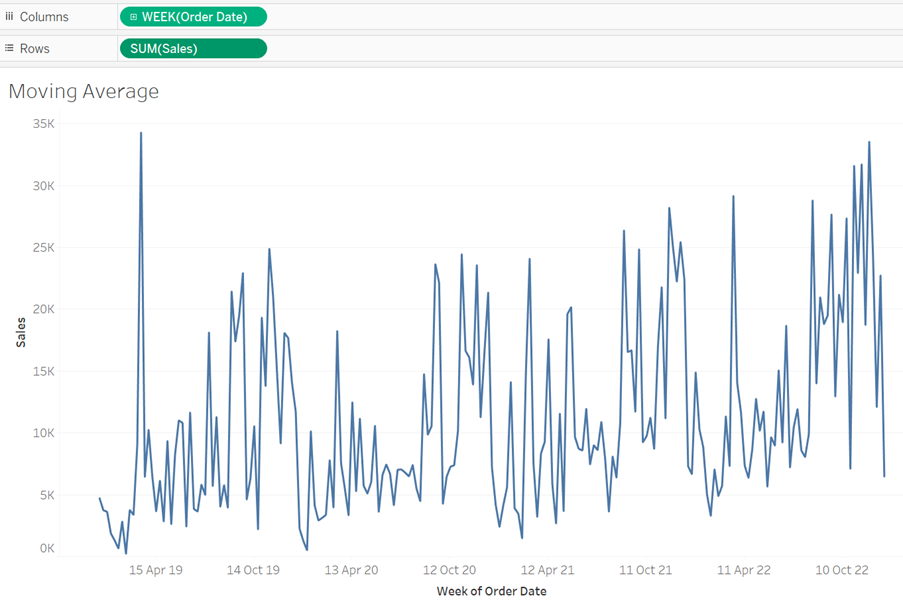
First, right click and drag your date value (Order Date) onto the columns tab and select week. Next move your number of sales. You should have a graph that looks like this:
Next you will have to bring in the moving average. So right click your sales pill, go to quick table calculations and press ‘Moving Average’.
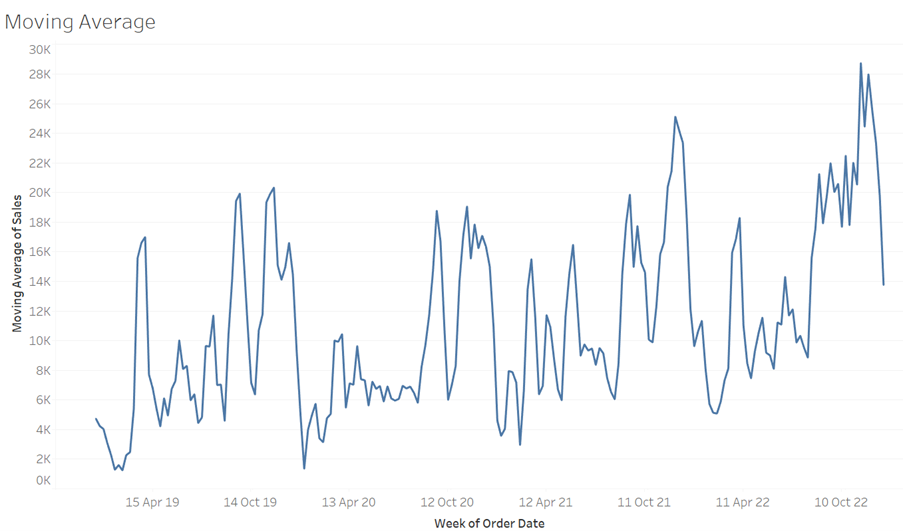
You will see the graph change, but by how many days has it averaged? In this example, we want to allow the user to change the number of days. In order to do this, we need to turn our moving average calculation, which is currently hidden in our ‘SUM(Sales)’ pill, into a calculated field.
So in order to do this, we need to drag the pill from the rows shelf, to the tables pane on the left, within the data pane. You will then get something that looks like this:
This is now a calculated field, and you can know this by looking to the left of the data type, you will see an equals (=) sign.
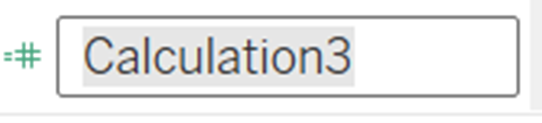
Name this whatever you like, I will name this ‘Moving Avg Sales’. Similar to how you would edit a normal calculated field, right click ‘Moving Avg Sales’ and press edit. You will see the window calculated field editor.
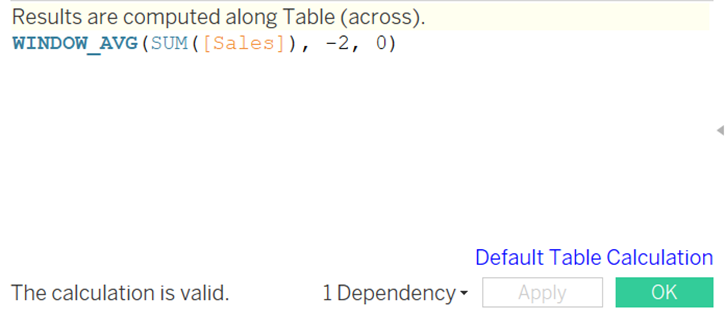
- WINDOW_AVG is the moving average on the window (hence the name).
- SUM([Sales]) you should recognize is what we want to use to calculate our moving average.
- The -2, is the amount we calculate the average, so ‘2’ is the number of days we add together and divide by, and ‘–‘ tells us to calculate the average using the two previous days.
- The 0 is our starting point.
We want to use parameters to change the number of days.
So let us create a parameter.
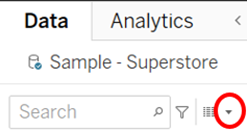
Press the downwards arrow circled here and press create parameter.
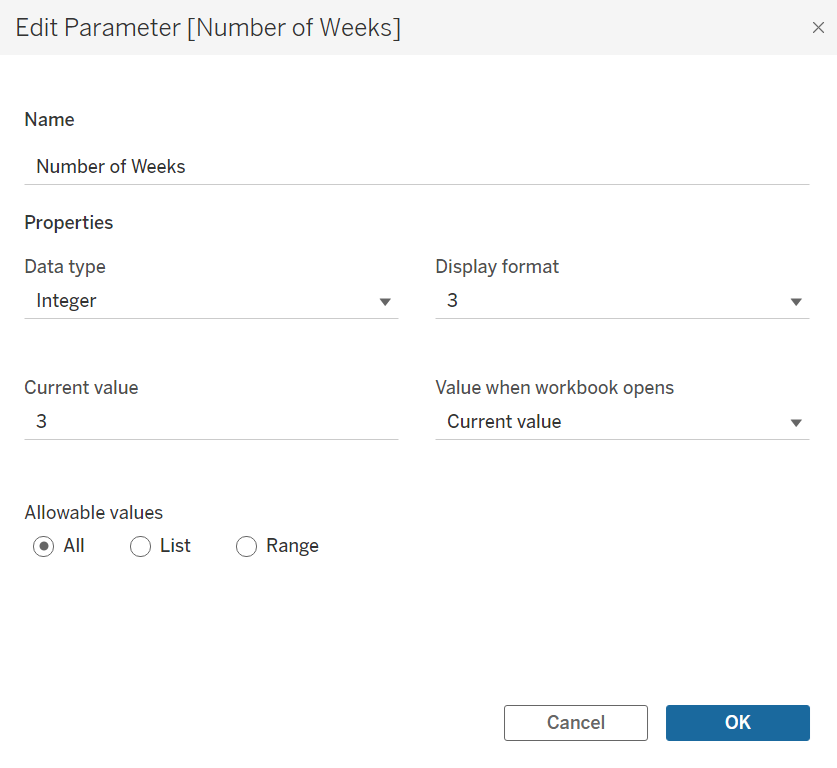
Since we want the user to input the number of days to use for our moving average and days are whole number values, our wanted data type is ‘Integer’. You can leave the rest of the properties as they are.
You should get something that looks like this:
Now in order to use this, we need to use this parameter in our previously created calculated field.
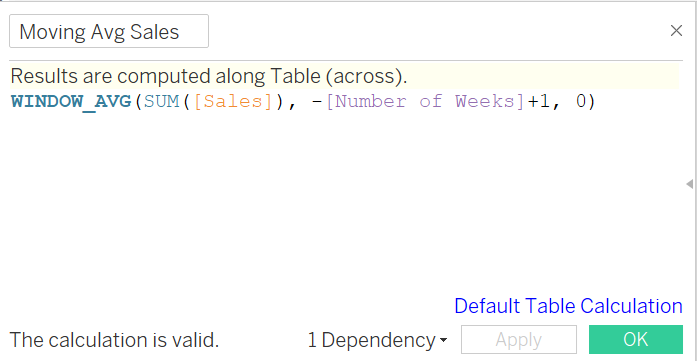
So find the calculated field in the data pane, I named it ‘Moving Avg Sales’, and go back to edit (right click in pane and press edit). Now input your parameter into the ‘number of days part’ which should currently be -2. Now to make this simpler to our users who want to know the 3 day moving average and not the 2 day moving average, we will input our parameter as ‘-[Number of Weeks]+1’. In the end it should look like this:
Now, swap this for SUM(Sales) in the rows pane.
In order to give the user the ability to change it, right click your parameter we created and press show parameter.
Now everything should be set up. Have fun!