


Snowflake, SQL & LEGO Data
“And just like that, we reached the final day of training…”
Here we are: August 1st, 2025. The final day of training for my cohort.
What a ride it’s been - from early Alteryx puzzles to 10-minutes-before-presentation Tableau tweaks, we’ve covered a lot. But today wasn’t about nostalgia. Today was about showing what we’ve learned.
And I, naturally, chose mermaids.
This blog post isn’t a sentimental farewell (well, maybe just a little). It’s a look into my final Dashboard Week challenge: wrangling LEGO datasets in Snowflake, writing SQL views to isolate summer-themed sets, and building a whimsical, data-driven dashboard exploring the iconic - and frankly underrepresented - mermaids of the LEGO universe.
Let me walk you through the magic.
Building the Base View in Snowflake
The first task was to wrangle the Rebrickable LEGO datasets into a single, clean view. Using Snowflake, I joined key tables (sets, inventories, parts, colors, themes, and minifigs) to isolate minifigures that matched summer-related keywords like “Mermaid,” “Beach,” “Surf,” and “Summer” in set or theme names.
Here’s a snippet of the SQL view I created:
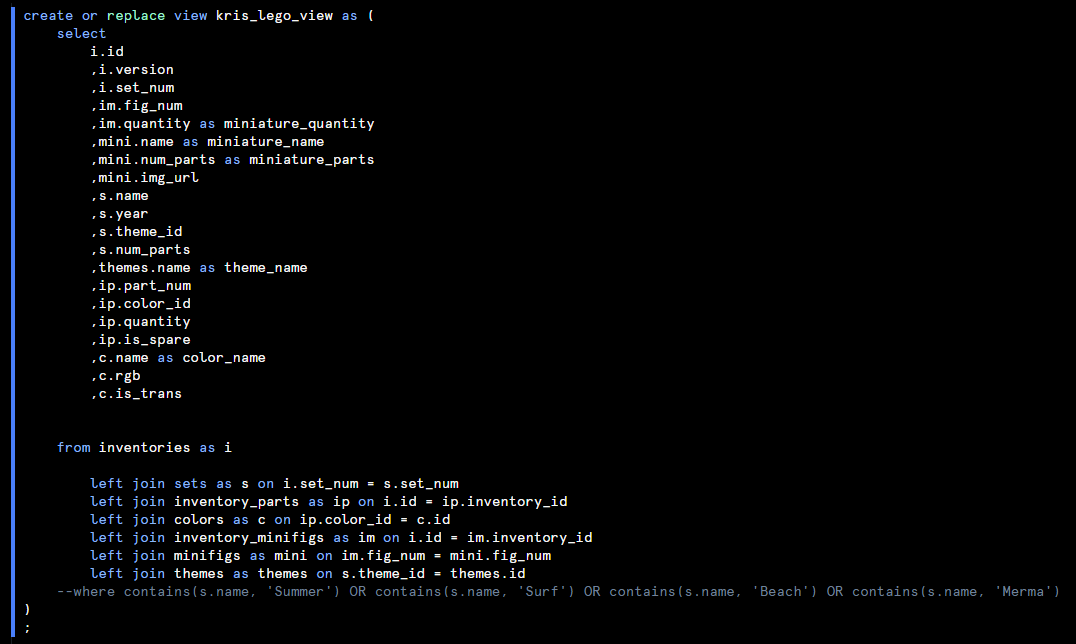
This view gave me the flexibility to explore mermaid appearances, parts, colors, and theme associations.
I initially filtered to where the name column in the sets table contains summer-related words (+"merma..."), but then decided to rather retrieve the full dataset and do the filtering in Tableau.
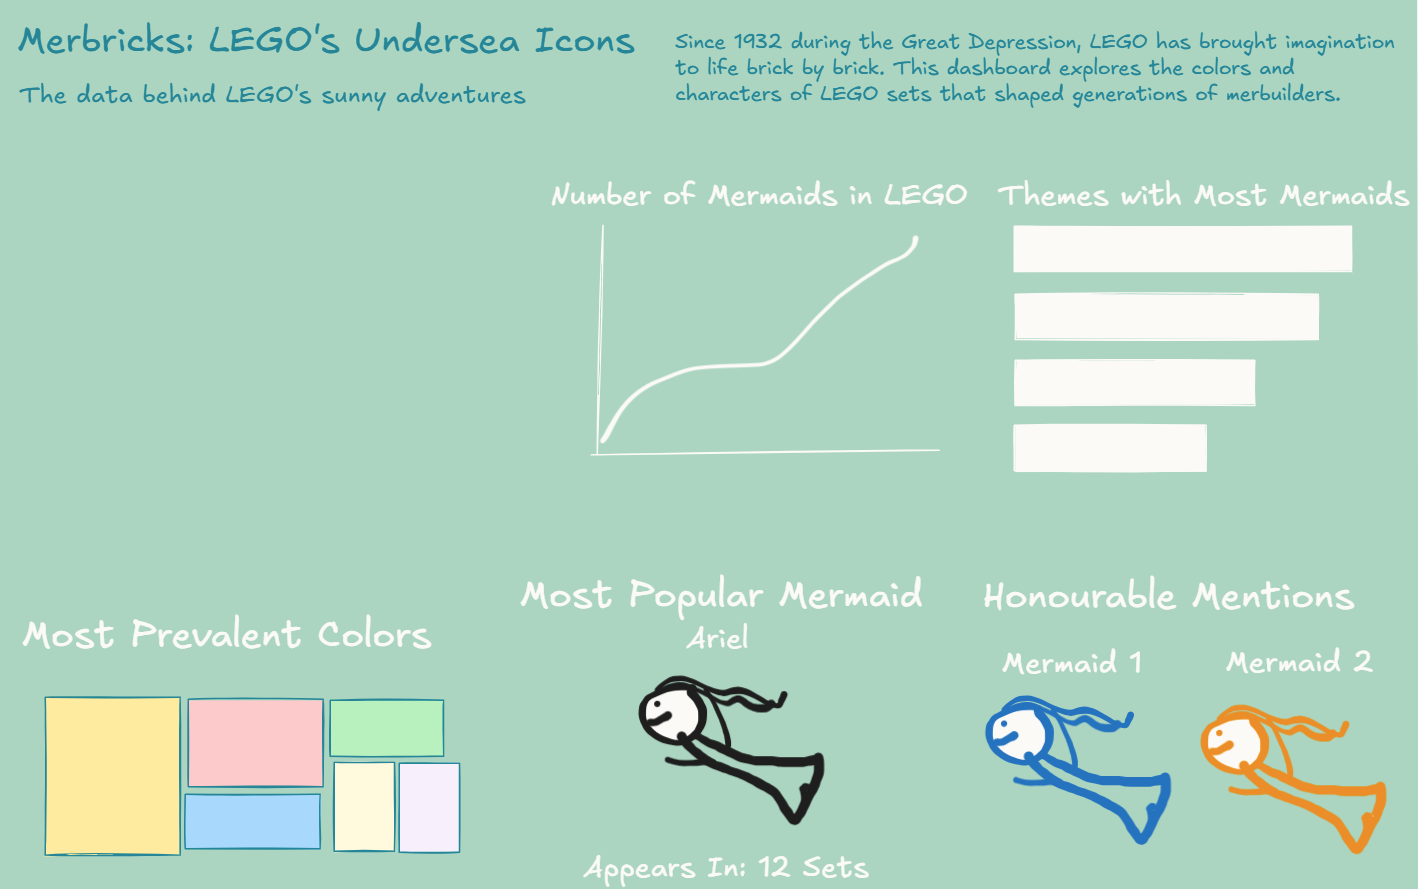
Sketching It Out
With a clear data structure, I created a sketch of the dashboard to plan the layout. The idea was to bring out the character and charm of LEGO mermaids — not just their numbers. I focused on:
- A growth line showing mermaid appearances over time
- Most common colors in mermaid-related sets
- Themes with the most mermaid figures
- And of course… highlighting the iconic mermaid divas who deserve more representation (or less, in Ariel's case...)
Building the Final Dashboard
In Tableau, I brought the sketch to life with a clean layout and consistent color palette. While I ran out of time to polish the design fully and make it as cute and exciting as I was planning to, I kept the layout true to the original concept.
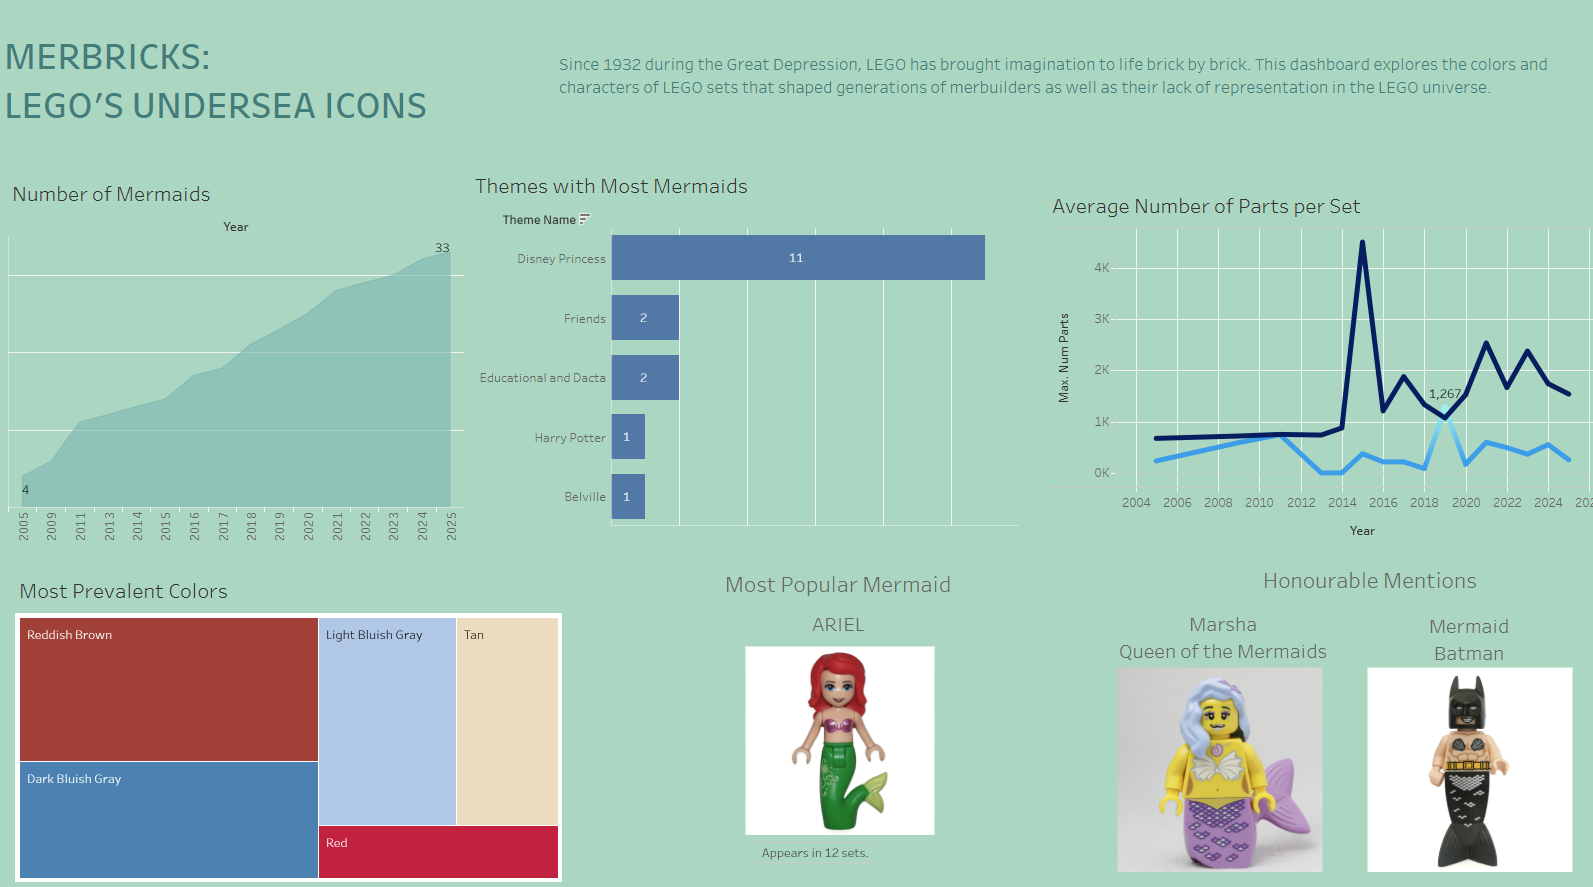
Key Insights:
- Mermaids have become increasingly common, with 33 mermaids released since 2005, but THAT IS NOT ENOUGH!!! We, the people, need more mermaid LEGO characters and sets.
- Disney Princess dominates, accounting for more than a third of all mermaid releases.
- Most LEGO sets that contain mermaids are still quite simple - the number of pieces they contain is nearly always below the overall average of pieces per any LEGO set.
- The most common colors include Reddish Brown, Light Bluish Gray, Tan, and various shades of blue - likely due to undersea accessories and settings. I did however exclude Black and White (which were the top 2 respectfully) in this chart as I wanted to look at more interesting colors.
- Unsurprisingly, Ariel is the most featured mermaid, appearing in 12 different sets.
- Honourable mentions go to:
- Marsha, Queen of the Mermaids
- Mermaid Batman (yes, that’s a thing. And yes, it’s amazing.)
Reflections
If I had more time, I would’ve pushed the design further - maybe added illustrated backgrounds, more iconography, and more interactive filters (e.g. tail color, theme type). I also would’ve loved to build out a “rarity” index for mermaid minifigs or visualise tail color evolution over time.
But even as it stands, this project was a fun blend of SQL logic, data storytelling, and a healthy splash of LEGO whimsy. It reminded me that even in the smallest niche - like plastic mermaids - there’s room to uncover trends, biases, and design evolutions!