


The Last Challenge
The final challenge of this tough week was to use SQL to clean and prep data ready for visualisation in PowerBI. Having not used SQL since the learning sessions it took some time to remember and figure out features, syntax and logic in order to achieve what I wanted.
To clean the data I first had to understand how each table within the schema needed to be related to one another and how the join statements needed to be written in order to extract all the data from each table.
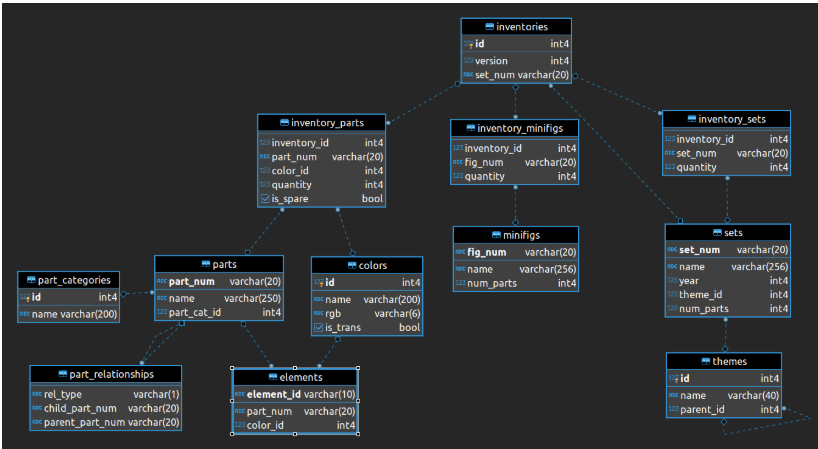
Once I had constructed my SQL scripts I then had to create views which required specifying which column is which if multiple tables had the same field names which subsequently meant having to outline every column from every table being joined.
Once the views had been created the next challenge was to import it into PowerBI to create the semantic model based on ID. Unfortunately for some reason there was a recurring error when trying to build the logical relationship so I had to go back into SQL and figure out what the error was in the views.
After some trial and error, the SQL script was reconstructed and started working, however, the process ate up most of the time allotted for the project so there was only a couple of hours for dashboarding.
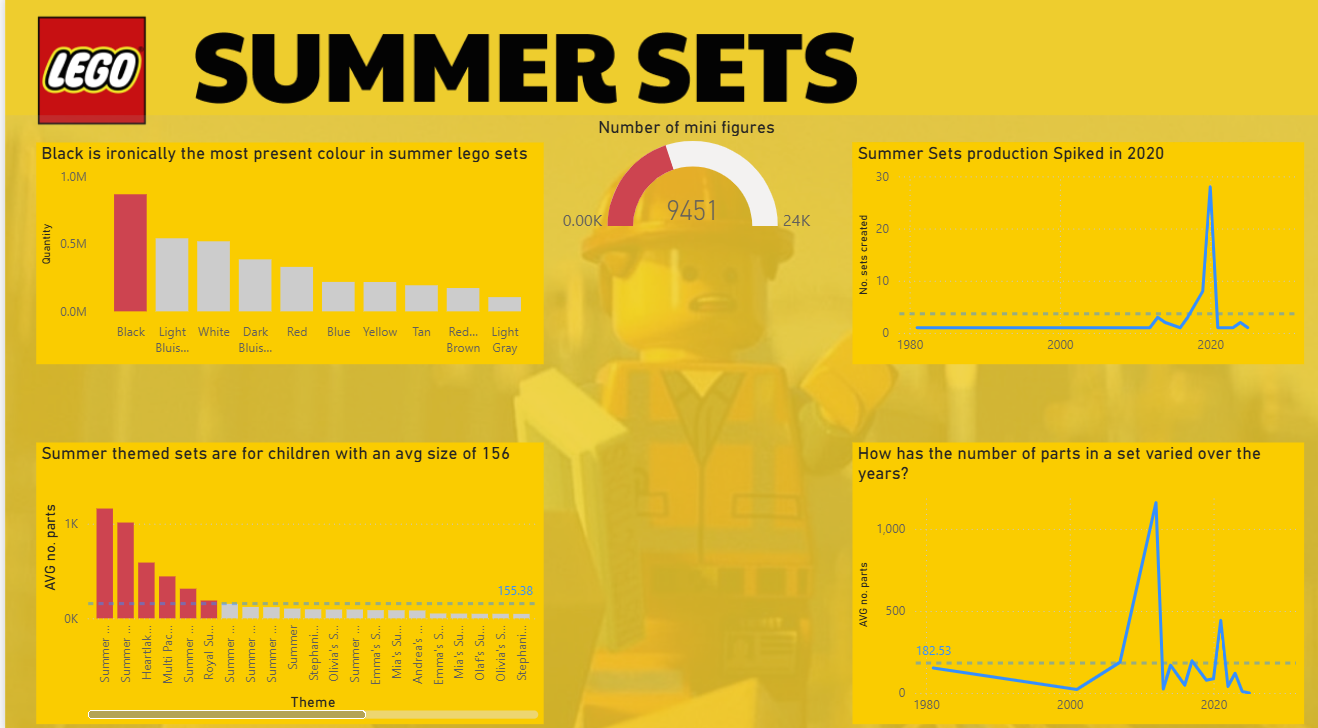
The final dashboard
Due to time pressure and having not properly assessed the data, the dashboard produced was rather simple and only gave brief insights into summer themed lego sets. I quickly made a background in figma and tried to format everything to look visually appealing but more data issues cropped up.
With some more time put into the visual aspect I will, like the other dashboards this week, polish it off and add some more insightful analysis to bring this mini project together.