


If you're a Power BI user learning how to use Tableau, you might want to looking for a way to implement cross-highlighting between charts.
First, what is cross-highlighting?
Cross-highlighting (also known as proportional brushing) is a feature in Power BI where users can click on a part of the dashboard they're interested in, and other charts will highlight any relevant information.
e.g. In Power BI, click on "California" in a map chart to highlight California's sales numbers in a bar chart.
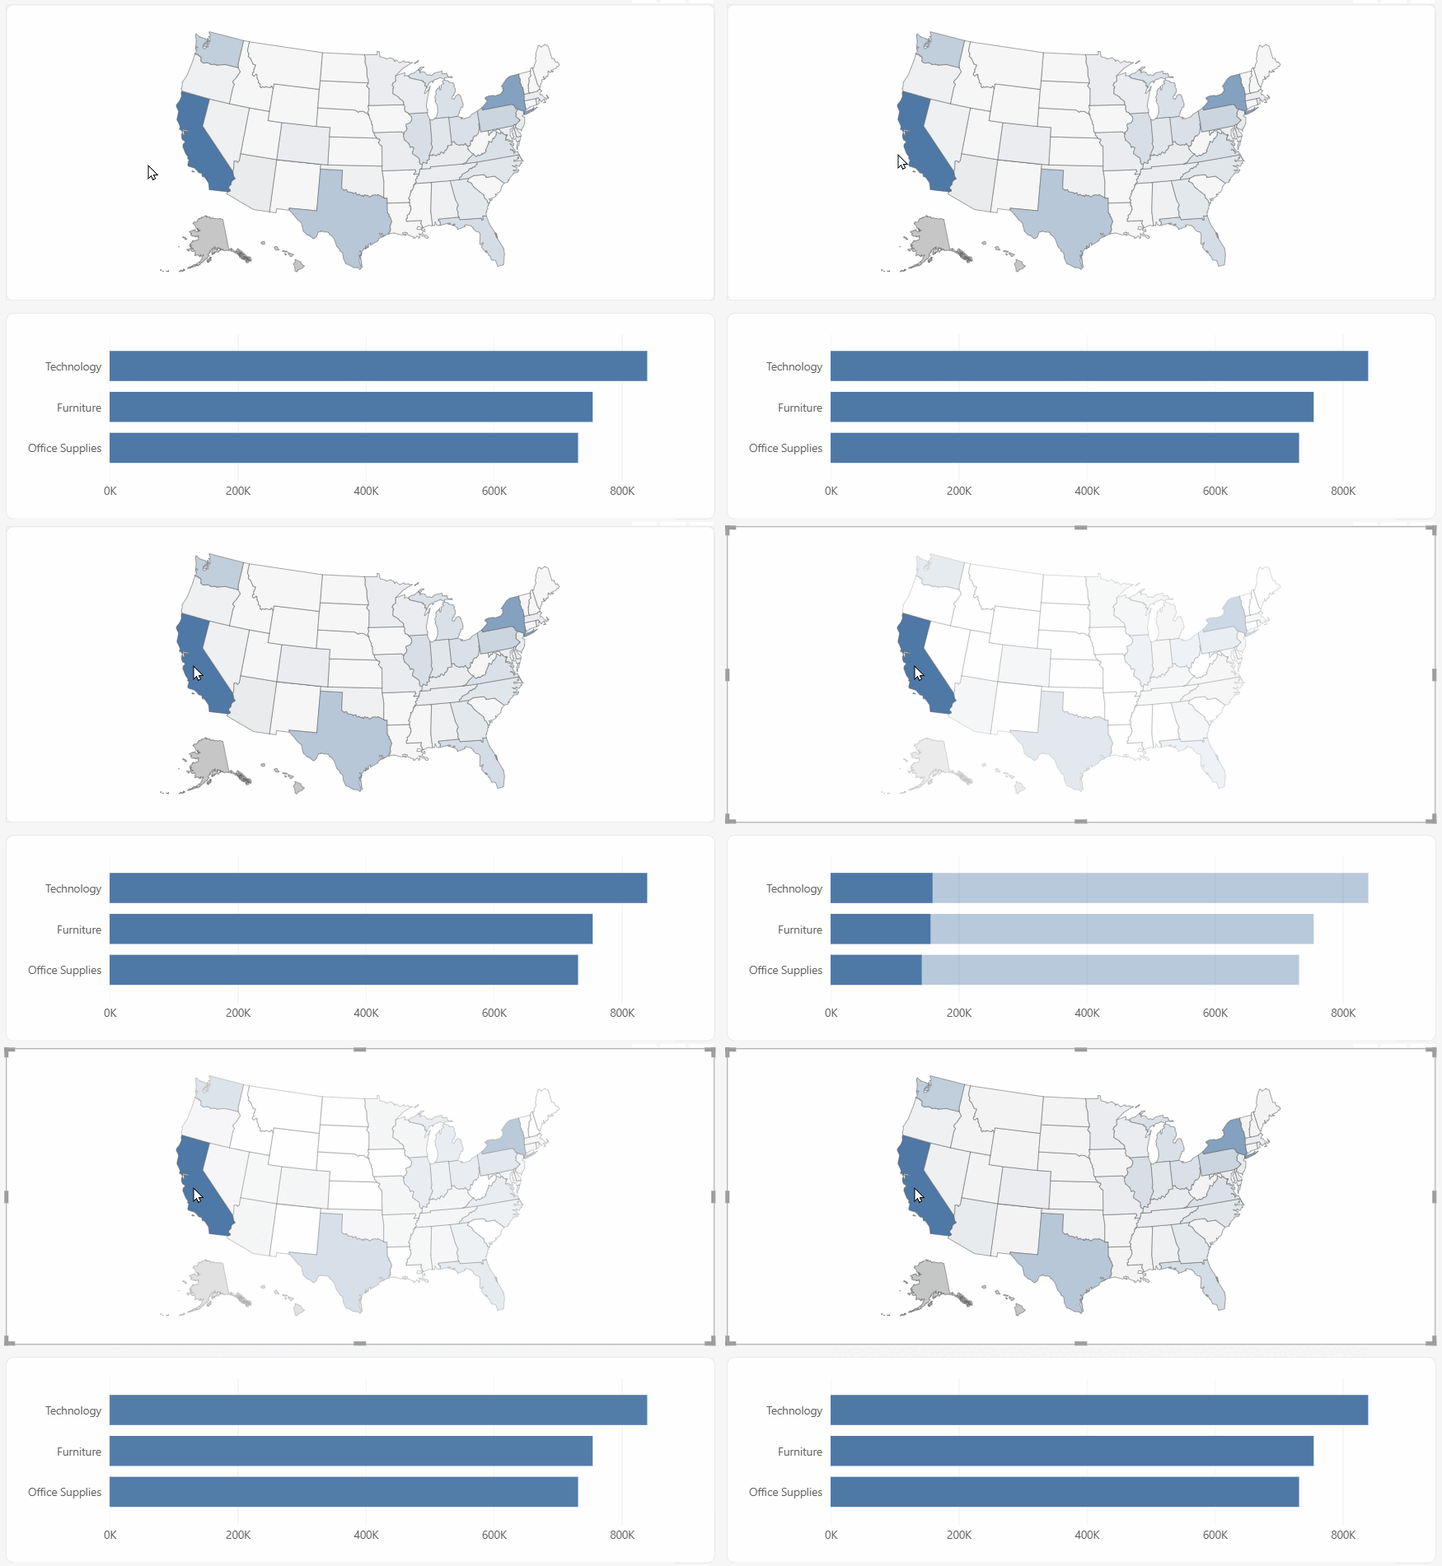
It's useful when you have multiple charts that cover a similar topic (e.g. sales revenue) and you want to let users take a closer look at specific parts of the data.
*Quick note: Cross-highlighting only works when charts use data from the same table or from tables that are properly related.
If it's not working across different tables, check that your data joins and relationships are set up correctly.
How does it work in Tableau?
Power BI comes with cross-highlighting out of the box, but how does this work in Tableau?
Like most differences between Power BI and Tableau, Tableau's version of cross-highlighting is super customisable (full control over the colors of the highlighed and un-highlighted sections, tooltips and animation speed), but requires more setup to implement.
By the end of this walkthrough you'll end up with a set of charts in Tableau with cross-highlighting (see below).
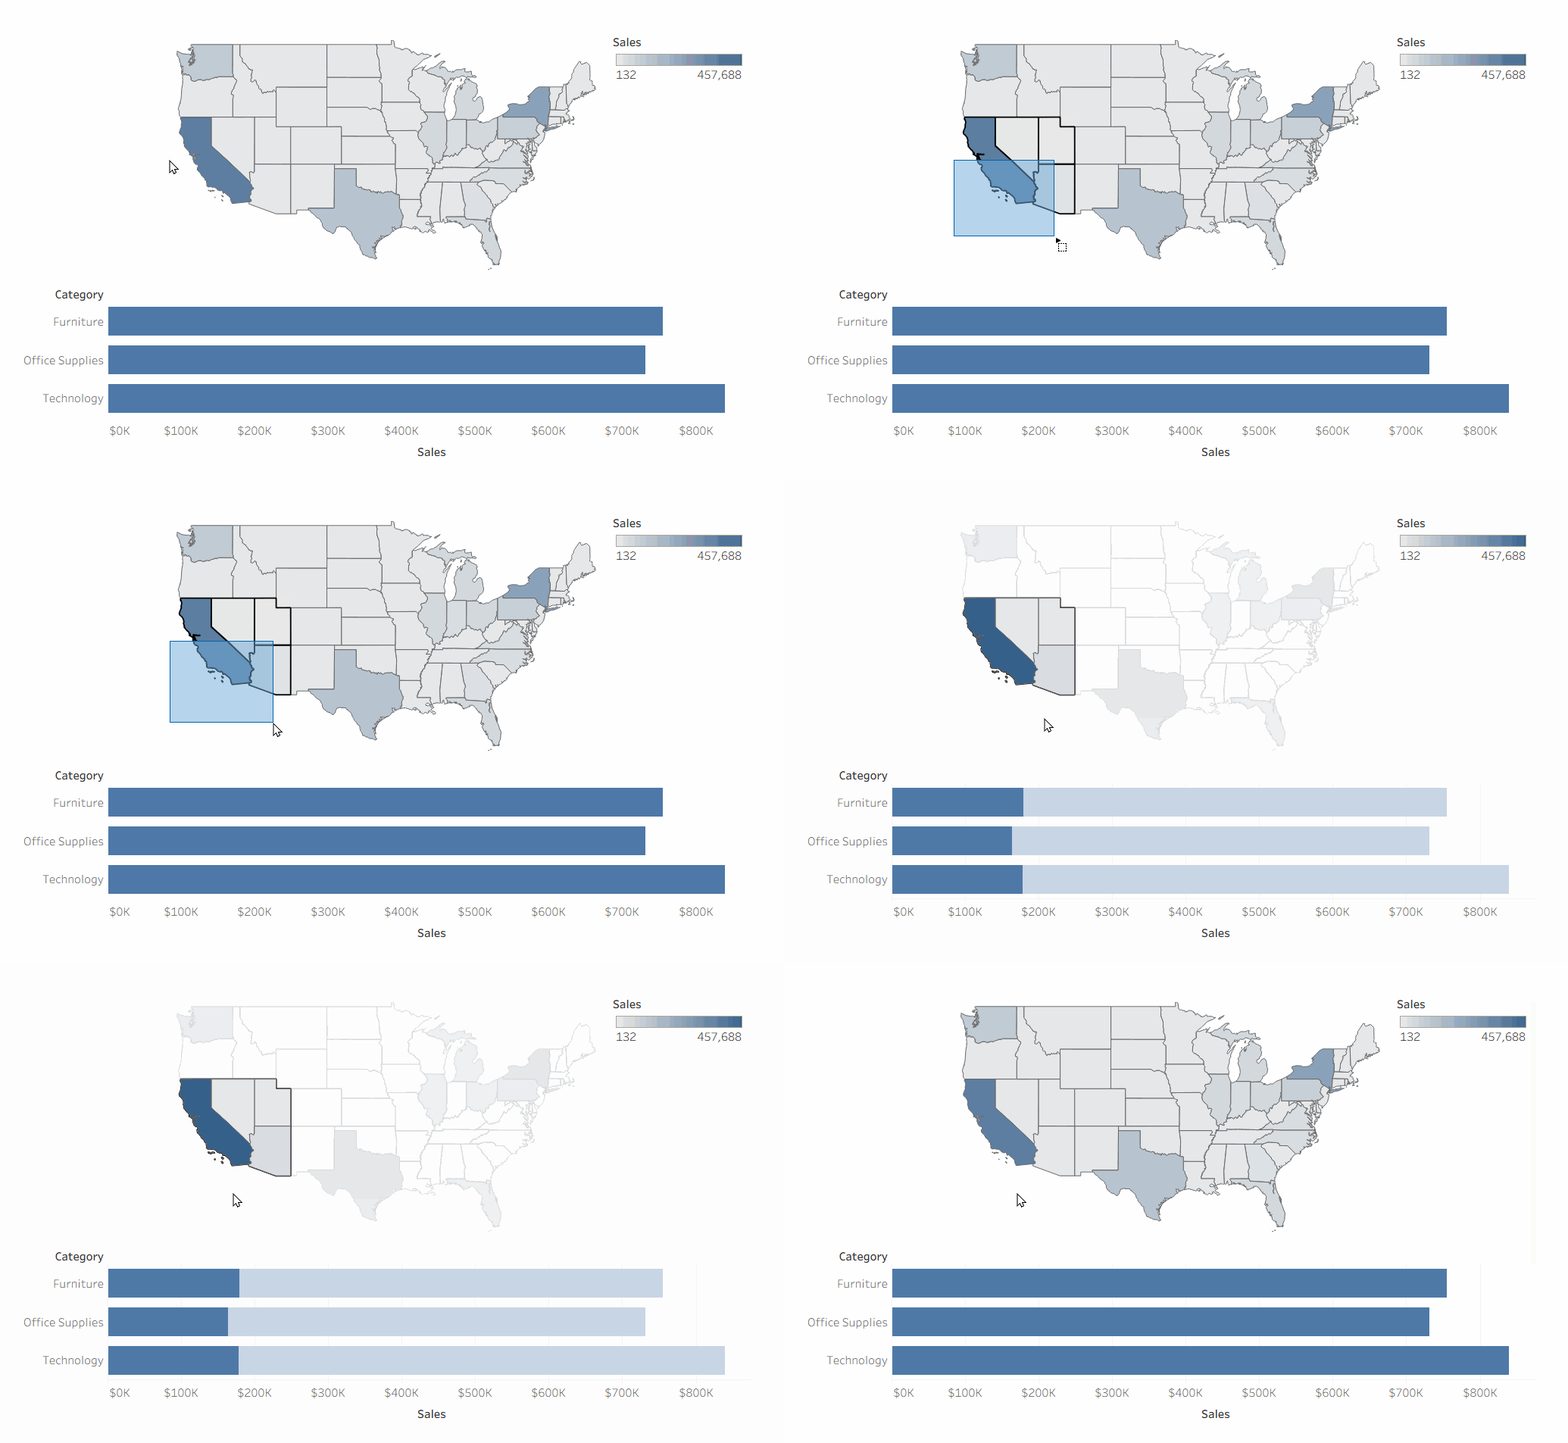
This example uses the "Sample - Superstore" dataset that comes pre-installed with Tableau and Tableau Public.
Getting Started
We'll need at least two visualisations, and they need to be in a dashboard together.
These can be between most types and any number of charts, but for this example we'll use a map chart and a bar chart.
For this walkthrough, we'll highlight the bar chart when a US state is clicked on the map.
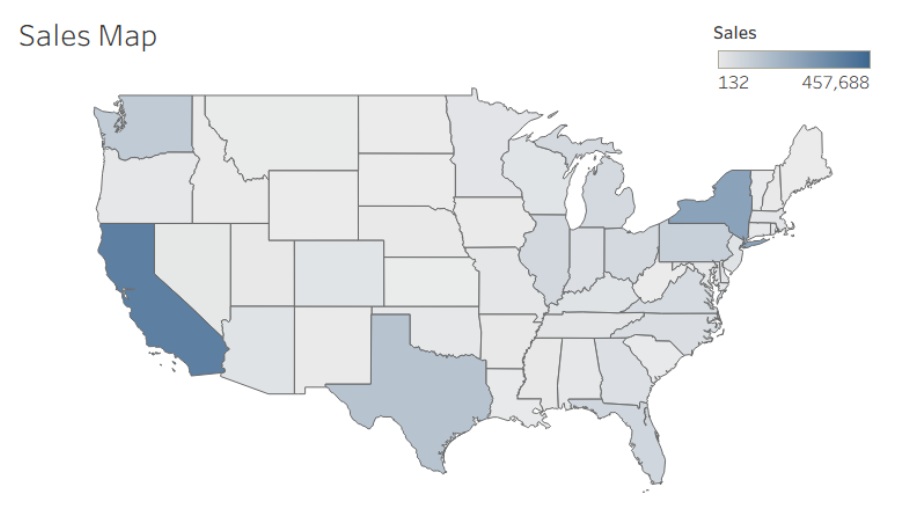
1) The chart that users click on:
This can almost any visualisation, even a button BAN/KPI or text, as long as it's made in a worksheet.
2) The chart that gets highlighted:
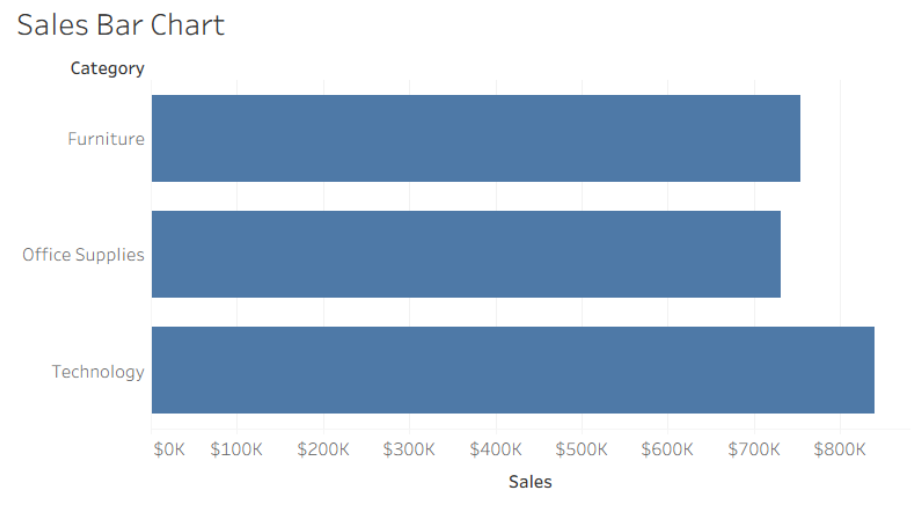
Using sets to create a highlight
We'll use sets and actions to track whether we've clicked on a section of our first chart. Let's first create a set, and we'll cover actions later in the walkthrough.
This set will be used to split the chart into highlighted and non-highlighted sections.
We won't cover exactly what sets are here, but just know that they're a way of categorising data (e.g. "Put products that are cheaper than $10 into one category, and all other products into another category").
If you want to know more about sets, read here.
Creating the set
First navigate to the chart that we'll be clicking on and create a set:
This is done by going to the field the user will click to create a highlight and navigating to Create → Set.
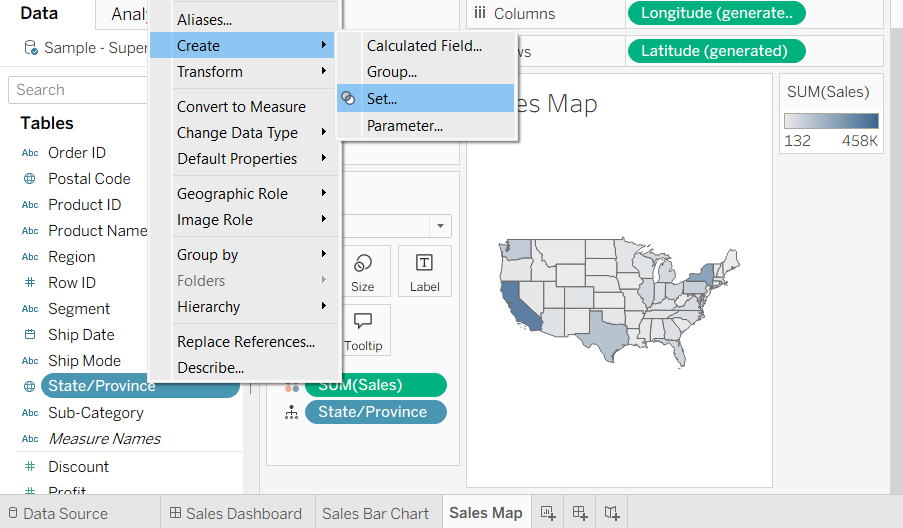
You'll see a menu pop up. Select any item (this isn't necessary, but makes it easier to see our set in action), give it any name you want, then click 'OK'.
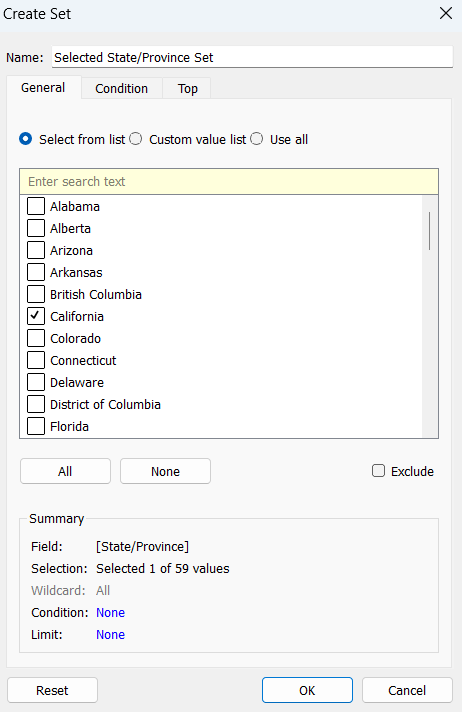
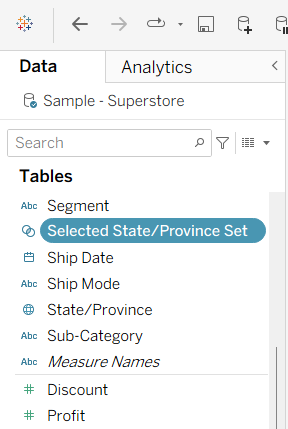
You should now see it appear on the data pane on the left.
Creating the highlight
Now navigate to the chart that will get highlighted.
Drag the new set to "Color", and you'll see the chart split into two.
Additionally, right-click the set and select "Show Set".
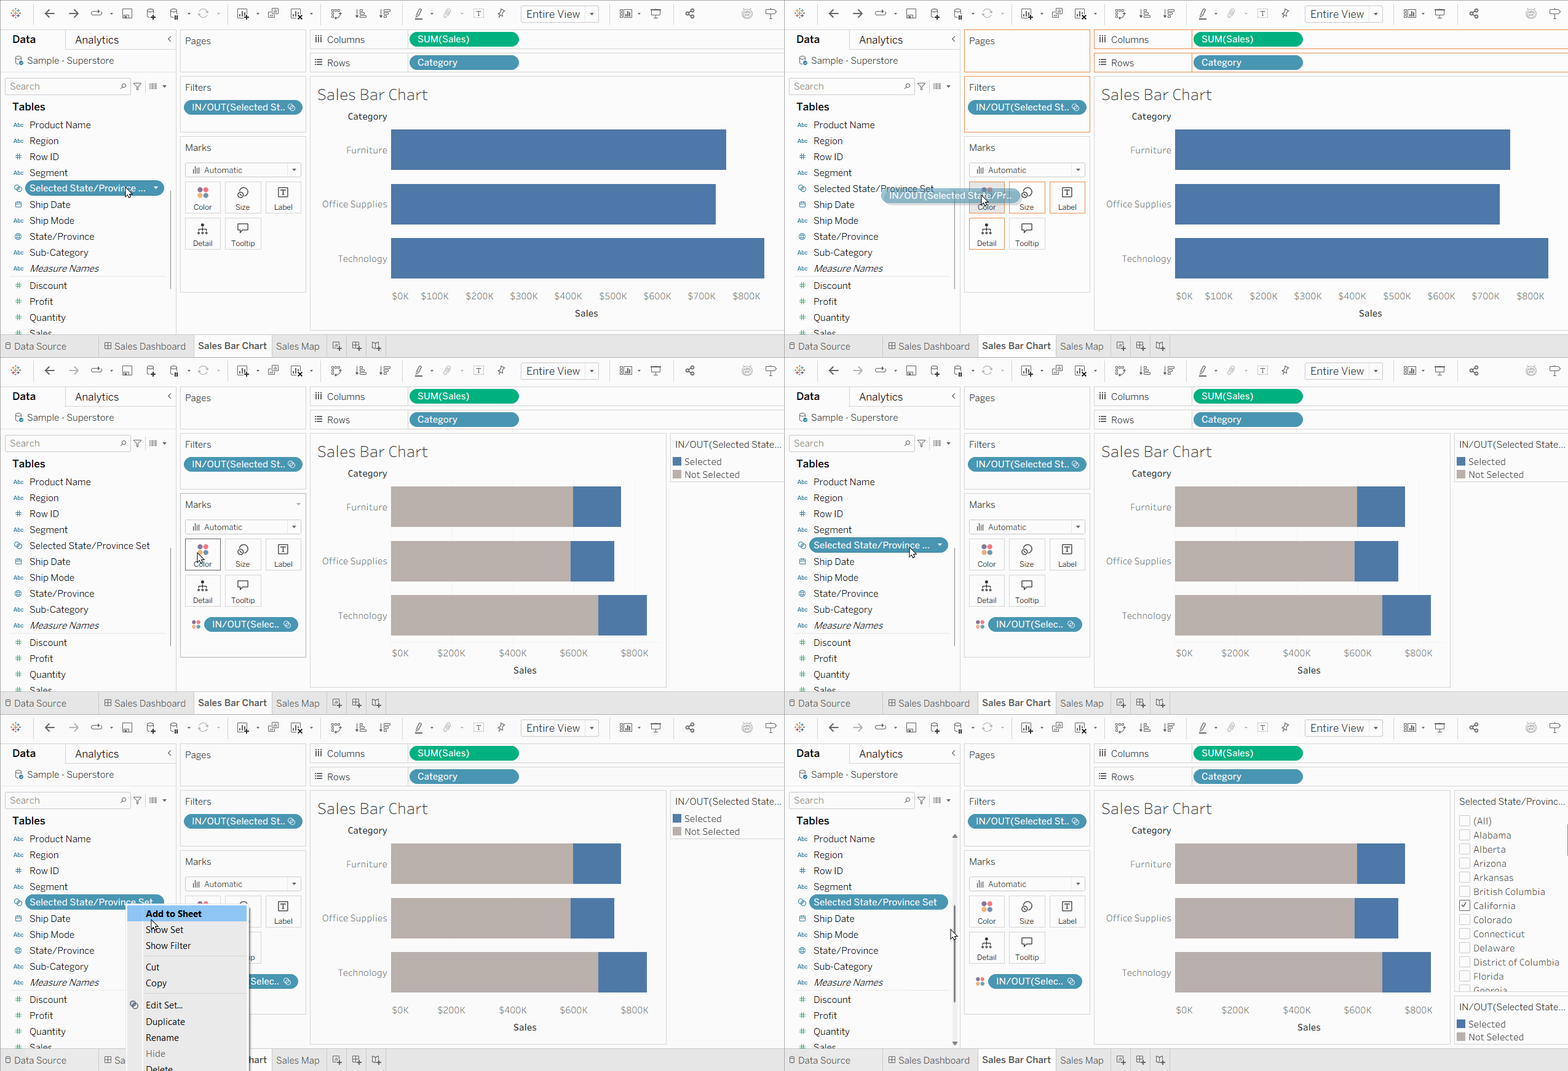
This colored section will be our highlight. Feel free to change the colors here
In this example, the selected item in the set ("California") creates a highlight of sales made in California. (e.g. 15-20% of sales in each category were made in California)
Don't see any colors?
Right-click the set and toggle "Show Set". Try selecting more items.
Still don't see any colors? Double check that your set is in "Color" and not in "Detail".
Positioning the highlighted section
When cross-highlighting bar charts, the highlighted section is always next to the headers/labels
(usually on the left for horizontal bar charts, or the bottom for vertical bar charts).
Click + drag the colors on the right-hand side of the screen to reorder them.
![Set - change order.gif [crop output image]](https://s4.ezgif.com/tmp/ezgif-42cbde1aa8f00ebb.gif)
Using Actions to create an "on-click" cross-highlight
Now, let's create an action that handles the on-click highlight.
"Actions" are a feature in Tableau that lets you do various things when a user interacts with the dashboard.
In this case, we'll create an action that adds and removes items to our highlight set using mouse clicks.
If you want to learn more about actions, read here.
Additionally, if you want to learn more about actions involving sets, read here.
Create an Action
In your topbar menu, go to Worksheet → Actions → Add Action → Change Set Values.
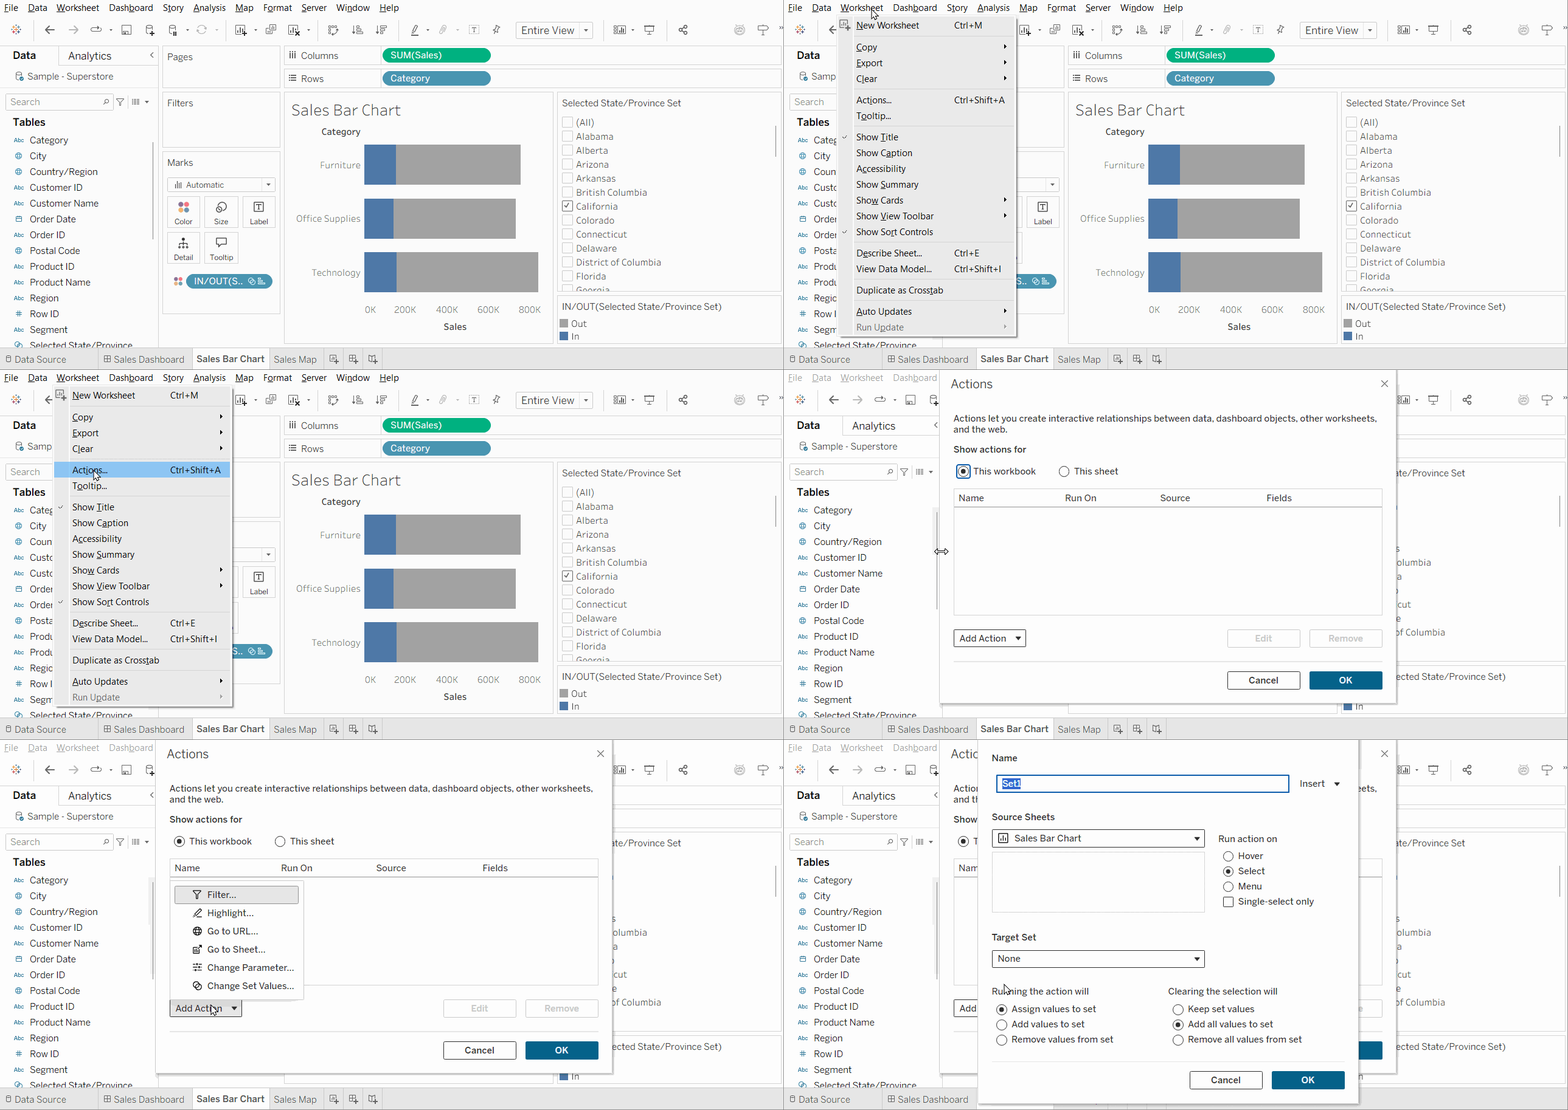
This will open up a menu.
We want to set up an action that does these things:
- When we click something (in the chart we'll be clicking on), add that item to the set and remove every other item from the set.
- When we click off the chart, add all items to the set we made.
This makes sure that the highlight is reset when we click off the chart. - The above should happen when we're in our dashboard that contains both charts (make a dashboard and put both charts in if you haven't already).
An action that does all of the above will look something like this:
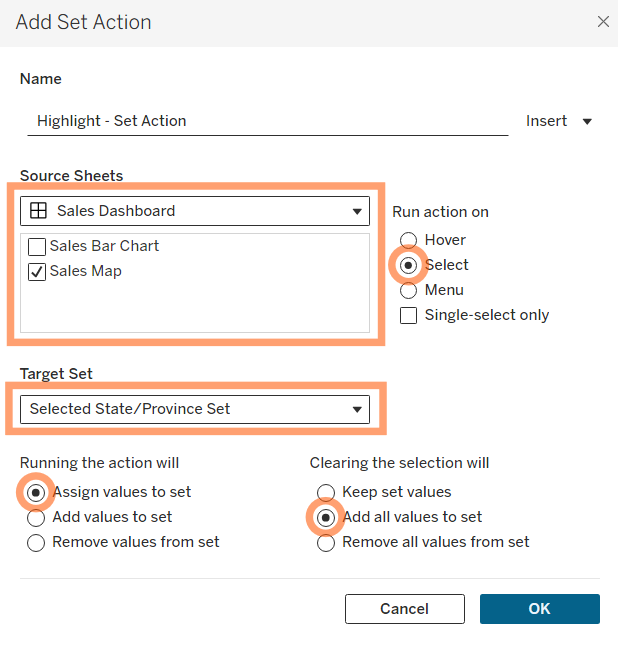
Let's break this down:
- "Source Sheet" is set to our Dashboard, and only our clickable chart is selected.
- "Run action on" is set to "Select" - This makes our action run when we click/select something. You can actually click+drag to select multiple items.
- "Target Set" is the set we made earlier.
- "Running the action will" is "Assign values to set" instead of "Add values to set" - This makes sure only the item(s) we select get added to the set, and everything else is removed.
- "Clearing the selection will" is "Add all values to set".
Putting it all together
Now, when we go to our dashboard, you should now be able to click on your chart and see our cross-highlight appear. Clicking off the chart makes the highlight disappear.
![Set Action Demo1_full.gif [cut output image]](https://s3.ezgif.com/tmp/ezgif-3098d3f671a1f73f.gif)
Fantastic!
If the highlight doesn't appear, make sure that the action's "Source Sheet" is set to your dashboard.
Recap
We've created cross-filtering in Tableau using Sets and Actions.
The set is used for creating a highlighted and non-highlighted section on our chart. An action is used to add items to our set when we click on them.