


Standard deviation is a statistical measure that shows how much data varies or spreads out from the average. It helps to understand whether the data points are closely grouped or widely scattered around the average (mean).
In data analysis, this is important because the average alone may not tell the full story. Two datasets can have the same average but very different levels of consistency or performance.
Example : Why Average Can be Misleading
Both Store A and Store B have the same average daily sales of £100.
However,
Store A has consistent sales every day, which shows stable and predictable performance.
Store B only made sales on Day 3 and had no sales on the other four days. Although its average is also £100, the performance is highly inconsistent.
Three Standard Deviation Rule
In a normal distribution, data is commonly explained using the three standard deviation rule, also known as the empirical rule.
The diagram shows how data is distributed around the mean (average). The highest point of the curve represents the mean, where most data points are concentrated. As we move farther away from the mean, the values become less common. According to the empirical rule, about 68% of data falls within one standard deviation, 95% within two standard deviations, and 99.7% within three standard deviations from the mean.
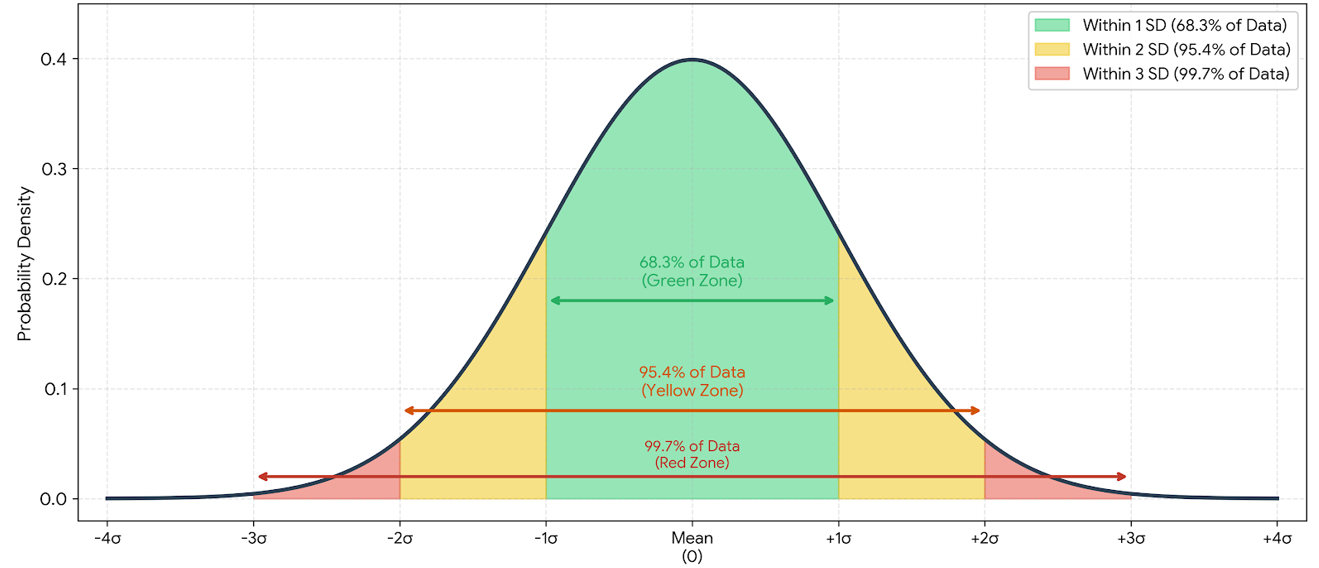
Within 1 standard deviation: 68.3% of data
The green zone shows the data that falls between -1SD and +1SD from the mean.
This means around 68.3% of the data is close to the average.
In a business context, this usually represents normal performance. For example, if most stores have sales within this range, their performance can be considered stable and expected.
Within 2 standard deviations: 95.4% of data
The yellow zone extends from -2SD to +2SD from the mean.
This means around 95.4% of the data falls within a wider range around the average.
Values in this range show more variation. For example, a store with sales near the edge of this range may be performing unusually high or unusually low compared with the average.
Within 3 standard deviations: 99.7% of data
The red area extends from -3SD to +3SD from the mean.
This means around 99.7% of the data is expected to fall within this range.
Data points outside this range are very unusual. They may indicate an outlier, a reporting error, fraud risk, a major operational issue, or an exceptional business event.
Examples of Business Use Case
Financial institutions: helps detect unusual transactions or spending patterns that may indicate fraud or financial anomalies.
Patient wait times: Hospitals use standard deviation to measure how consistently patients are being seen and identify periods of unusually long delays.
Manufacturing: Manufacturers monitor standard deviation to ensure product dimensions and quality stay within acceptable limits and reduce defects.
Hospital admissions: Standard deviation helps healthcare providers understand fluctuations in admission rates and prepare staffing and resources for unexpected surges.
Website loading times: Web teams use standard deviation to identify inconsistent page performance and detect spikes in slow-loading user experiences.
Summary
Standard deviation is an important statistical measure that helps us understand how spread out data is around the average. While averages provide a general overview, they do not show whether the data is stable, consistent, or highly variable.
By using standard deviation, businesses can better identify normal patterns, detect unusual behaviour, and make more informed decisions. Whether it is monitoring sales performance, detecting fraud, improving manufacturing quality, managing hospital operations, or analysing website performance, standard deviation helps organisations understand variability and respond to problems more effectively.
In the next blog, I will explain how to visualise standard deviation in Tableau.
Thank you for reading!