


I recently published a blog post explaining what standard deviation is and how it can be applied in business scenarios. You can access that article: Why Standard Deviation Matters in Business.
In this post, I will demonstrate how to create a standard deviation band in Tableau and use it to identify potential outliers.
For this tutorial, our objective is to identify unusual patterns in monthly sales activity during 2025. To illustrate the process, I will be using Tableau's Sample Superstore dataset.
First, drop the Order Date (continuous) pill into the columns.
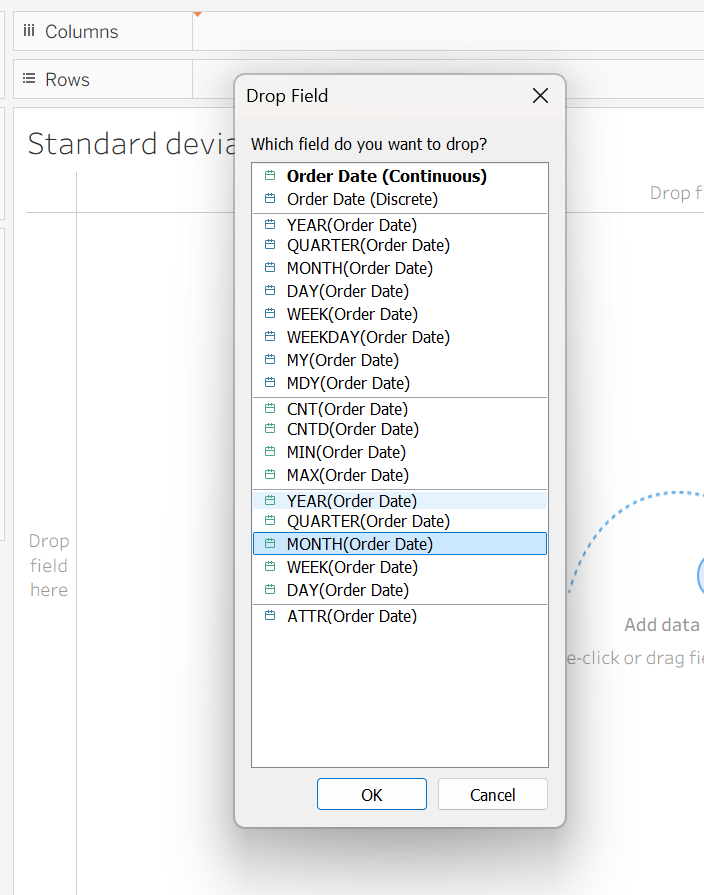
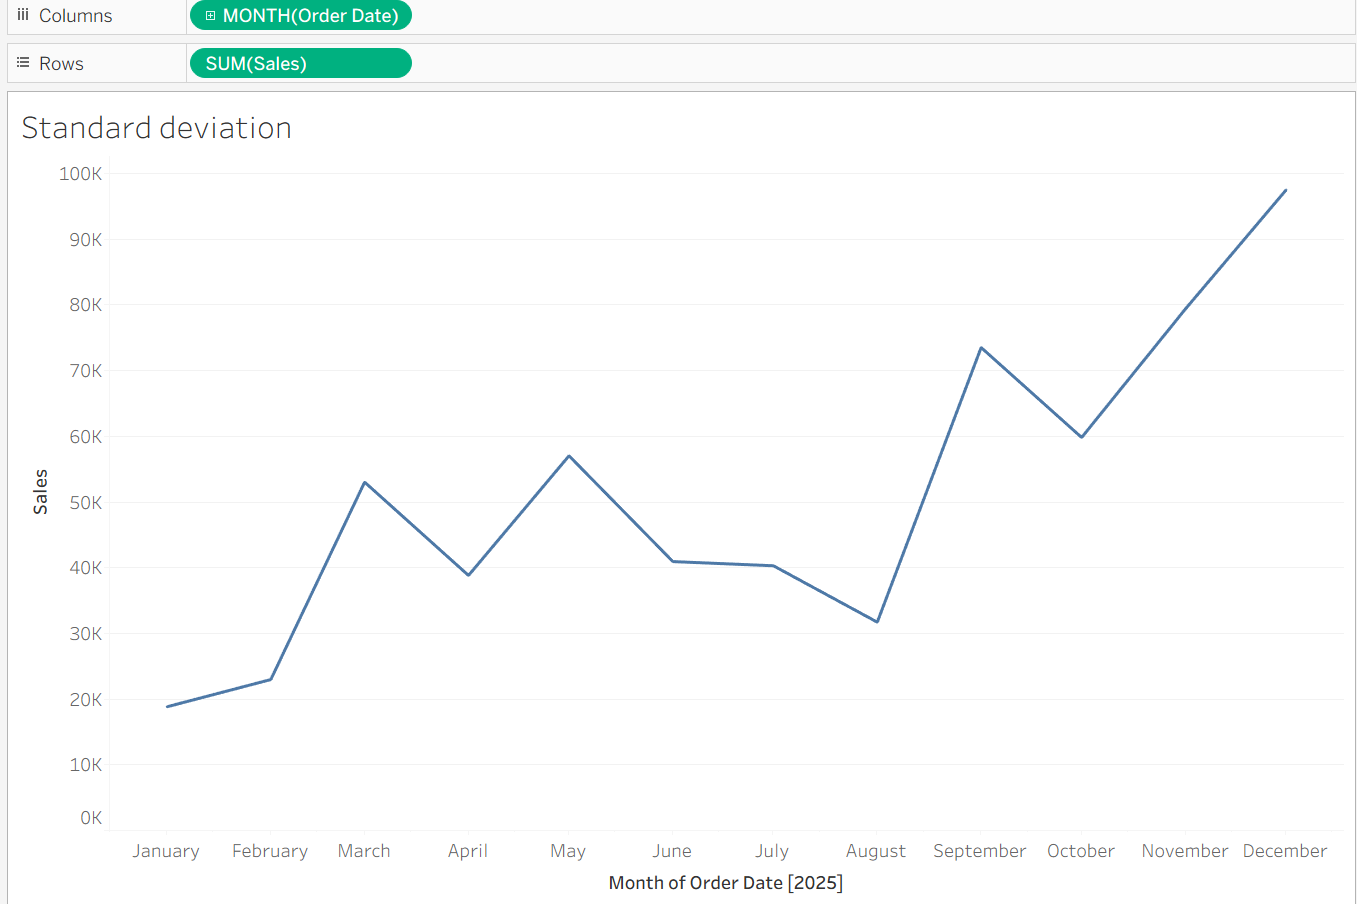
Drop SUM(Sales) onto the Rows shelf.
The view now displays the monthly sales performance for 2025, allowing you to visualise sales trends across the year.
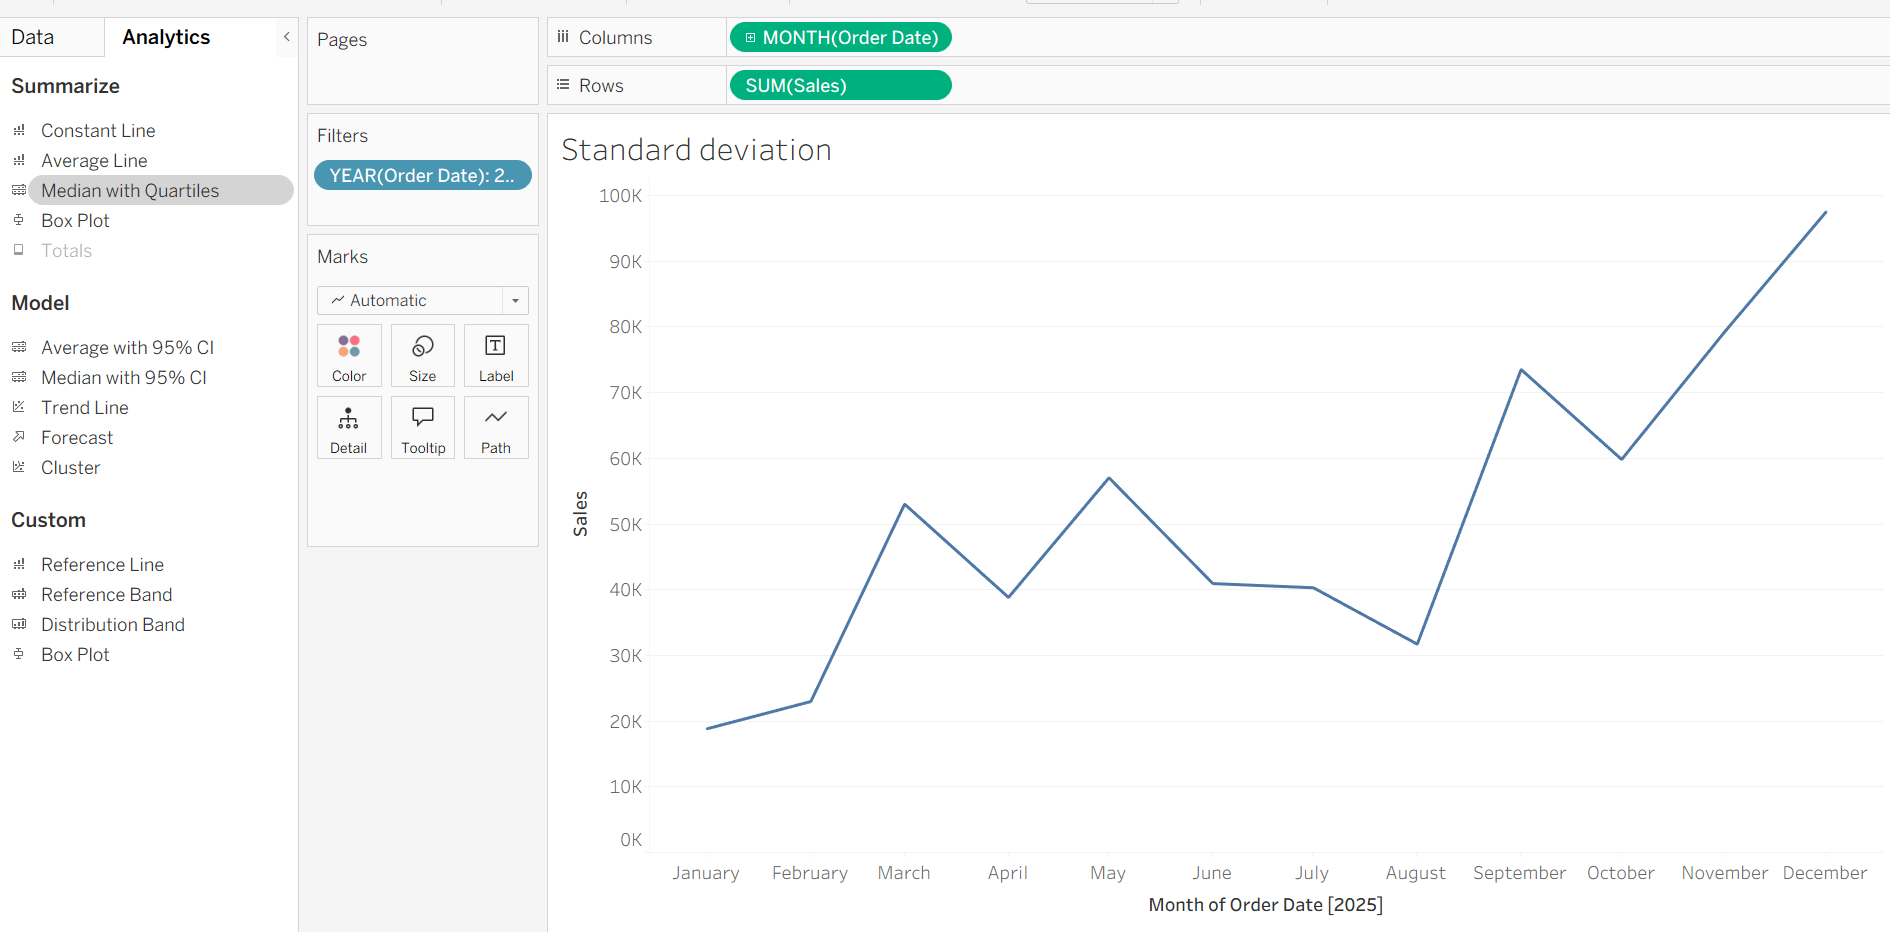
Navigate to the Analytics pane on the left side of the workspace.
Under Summarize, drag Median with Quartiles onto the chart and drop it on Table.
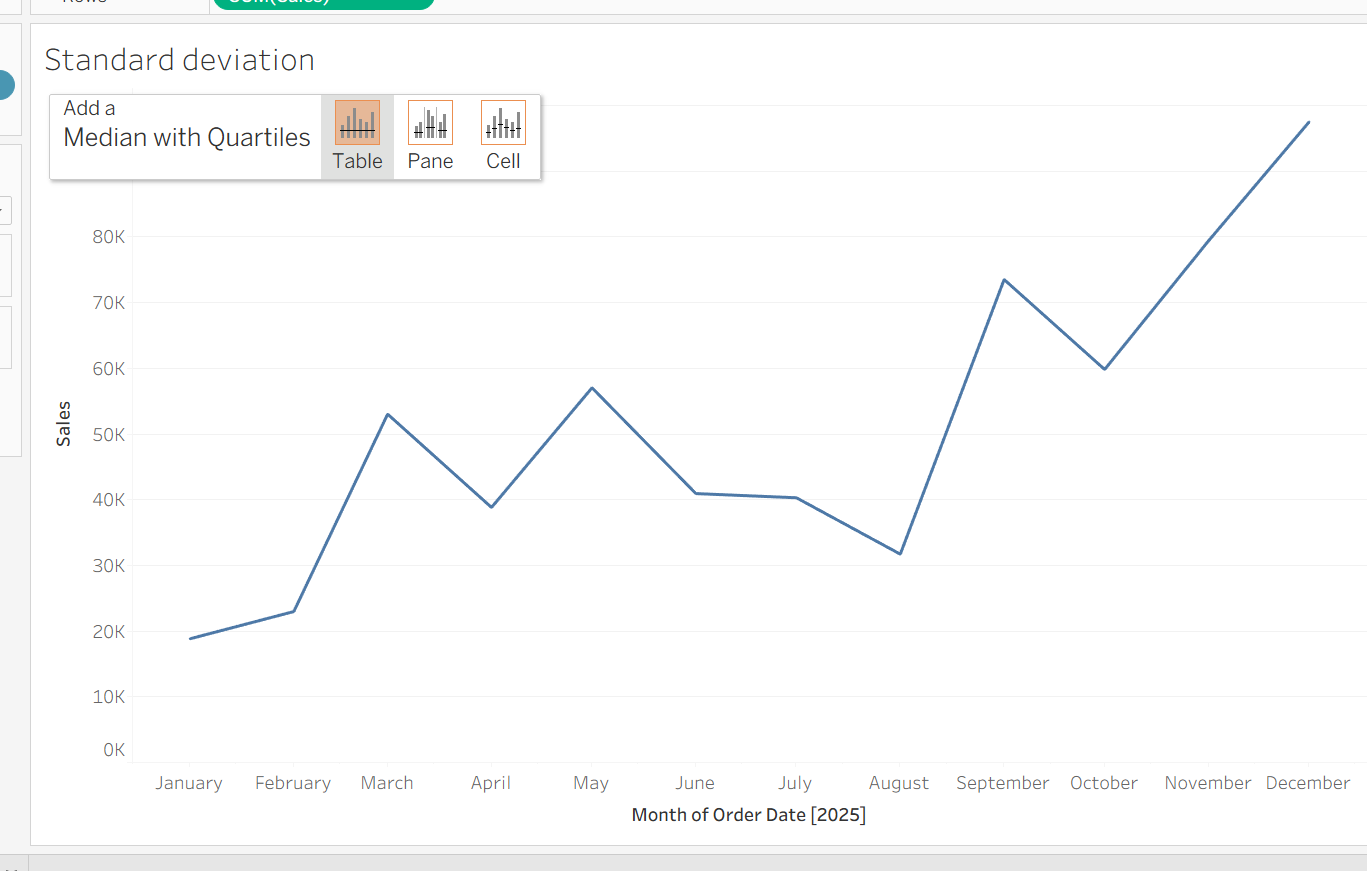
After dragging the field onto the Table, the median reference line will be added automatically. Click the reference line to edit it.
In the Edit Reference Line, Band, or Box dialogue box, select the Distribution tab. From the Value drop-down menu, choose Standard Deviation.
By default, the Factors field is set to 1, which corresponds to 1 standard deviation from the mean. You can modify this value if you want to display a different number of standard deviations.
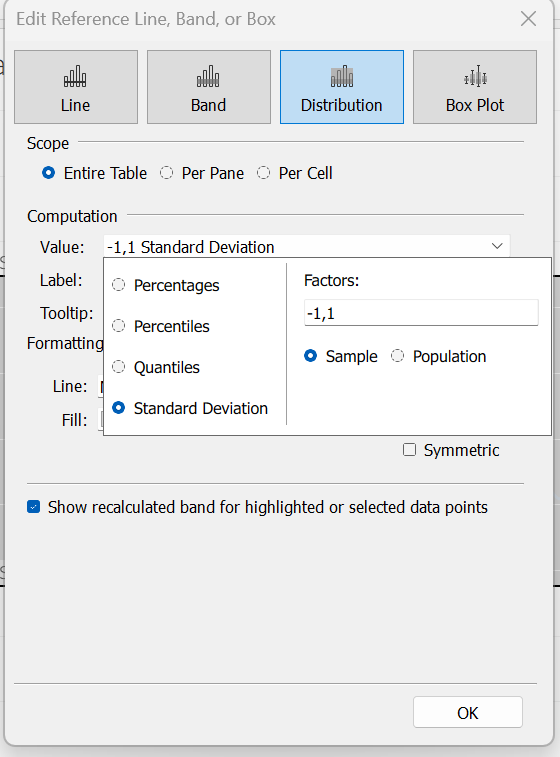
The shaded area represents ±1 standard deviation from the average sales value. Data points that fall within this band are considered to be within the expected range of variation.
Any values that fall outside the shaded standard deviation band may be considered potential outliers, as they deviate significantly from the overall pattern.
In this example, there are four data points with sales values outside the 1 standard deviation range:
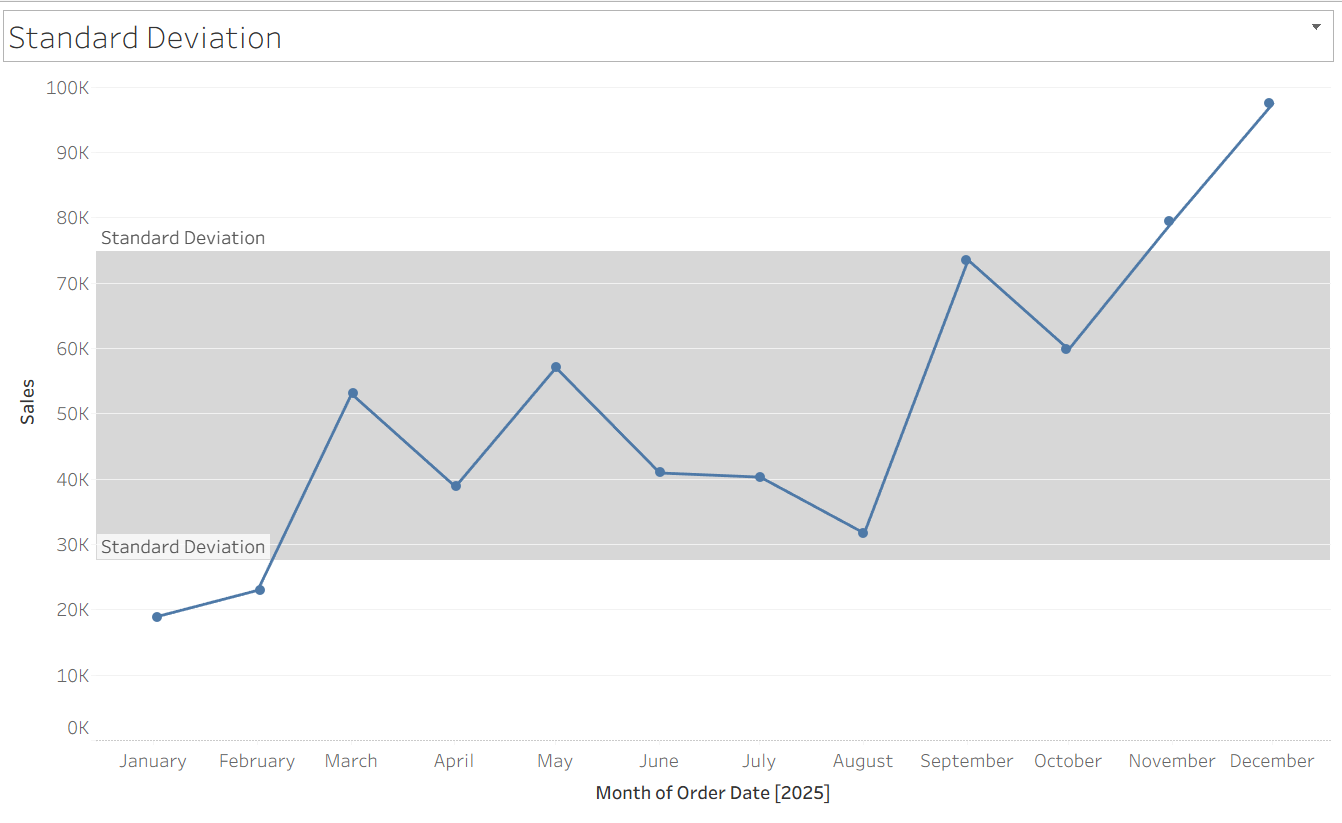
- January 2025
- February 2025
- November 2025
- December 2025
These values do not follow the expected sales pattern and should be further investigated to understand the factors driving the unusually low or high performance.
By analysing these exceptions, organisations can uncover valuable insights, address underlying issues, replicate successful strategies, and ultimately improve business outcomes. Standard deviation bands provide a simple yet effective way to highlight unusual performance and focus attention on areas that may require deeper analysis.
Thank you for reading!