As part of my tableau certification I am going through tableau calc functions. What a great opportunity to write a blog about them!
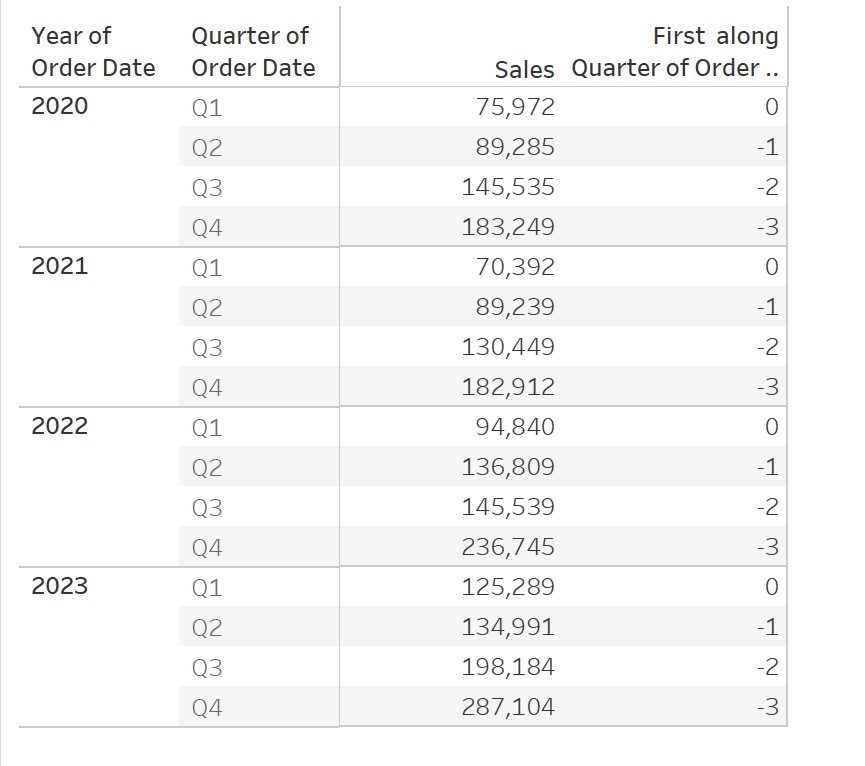
First(). This will simply return the number of rows to the first row. For example 2015 is the first row, this will return 0, if the data goes to 2020, first will then return -5. Below this, first is calculated with Quarter as a specific dimension but unticking Year. This means it restarts every year, giving us the number of rows from the first quarter.

A use case for this would be to filter always on the first row. Something to know is that if you decide to sort the quarters descending, Q4 will be come the first row, there first() will then return 0. It can also be used as good practice to compare a measure to the earliest data in the data. Using IF first()=0 THEN measure END for example. This can lead to a simple comparison like this:

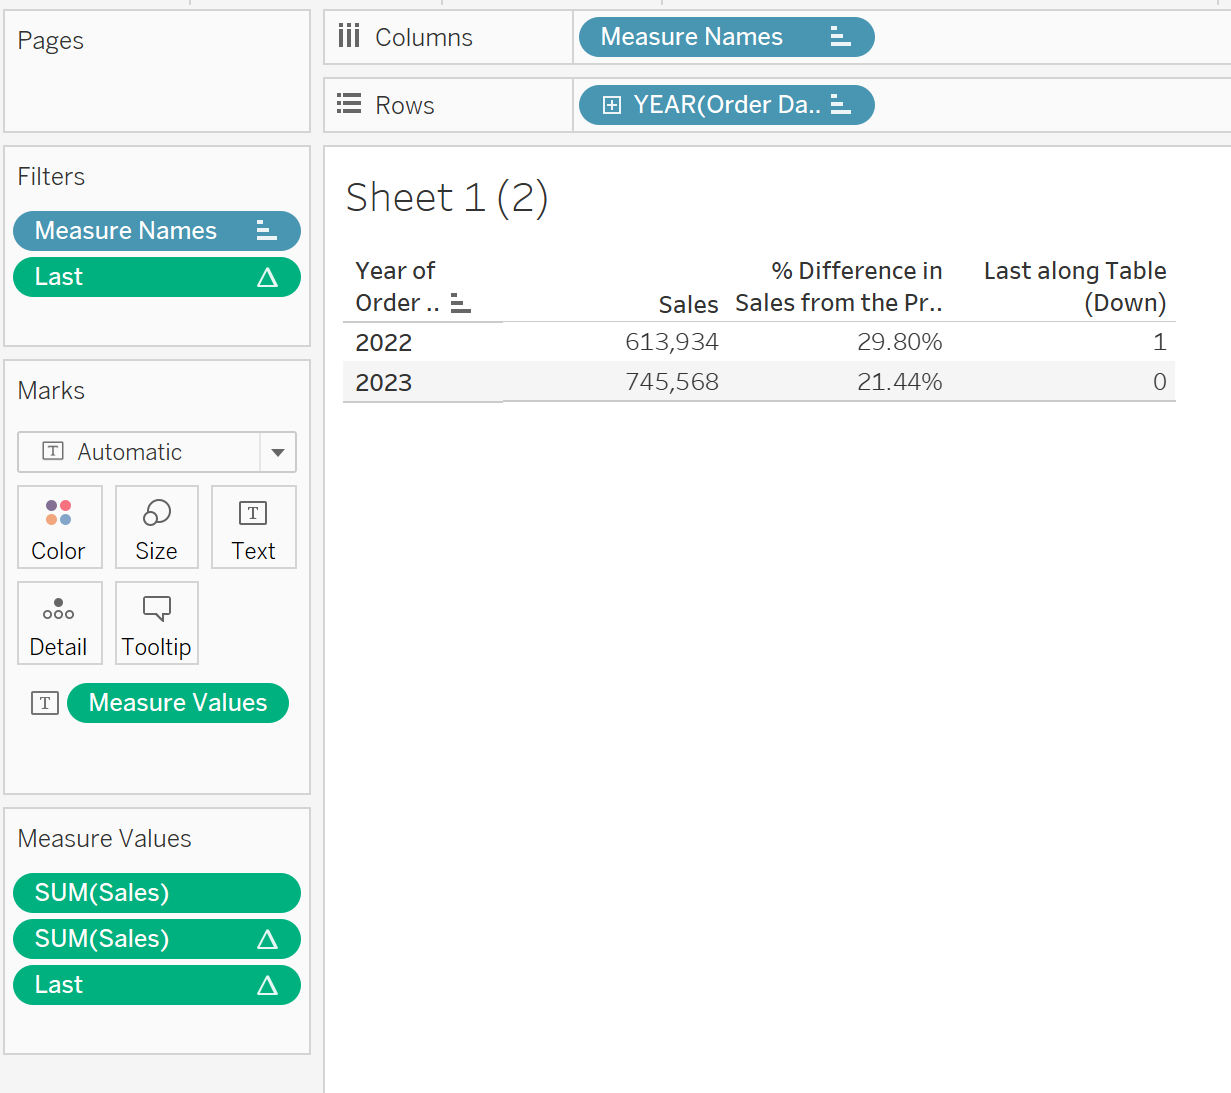
Last(). The Last function works exactly the same way as First(). As you can guess from the name the difference is that it starts counting from the end and goes up. So the last row is 0, the penultimate one is 1. A really cool use case is to calculate the percent difference of the last two years, in a way that whenever the data will update, or the granularity will change, the calculation will stay correct. To do this we do our normal quick table calc and obtain our percent difference. Then we add Last() as a filter and select the range to be 0 to 1.

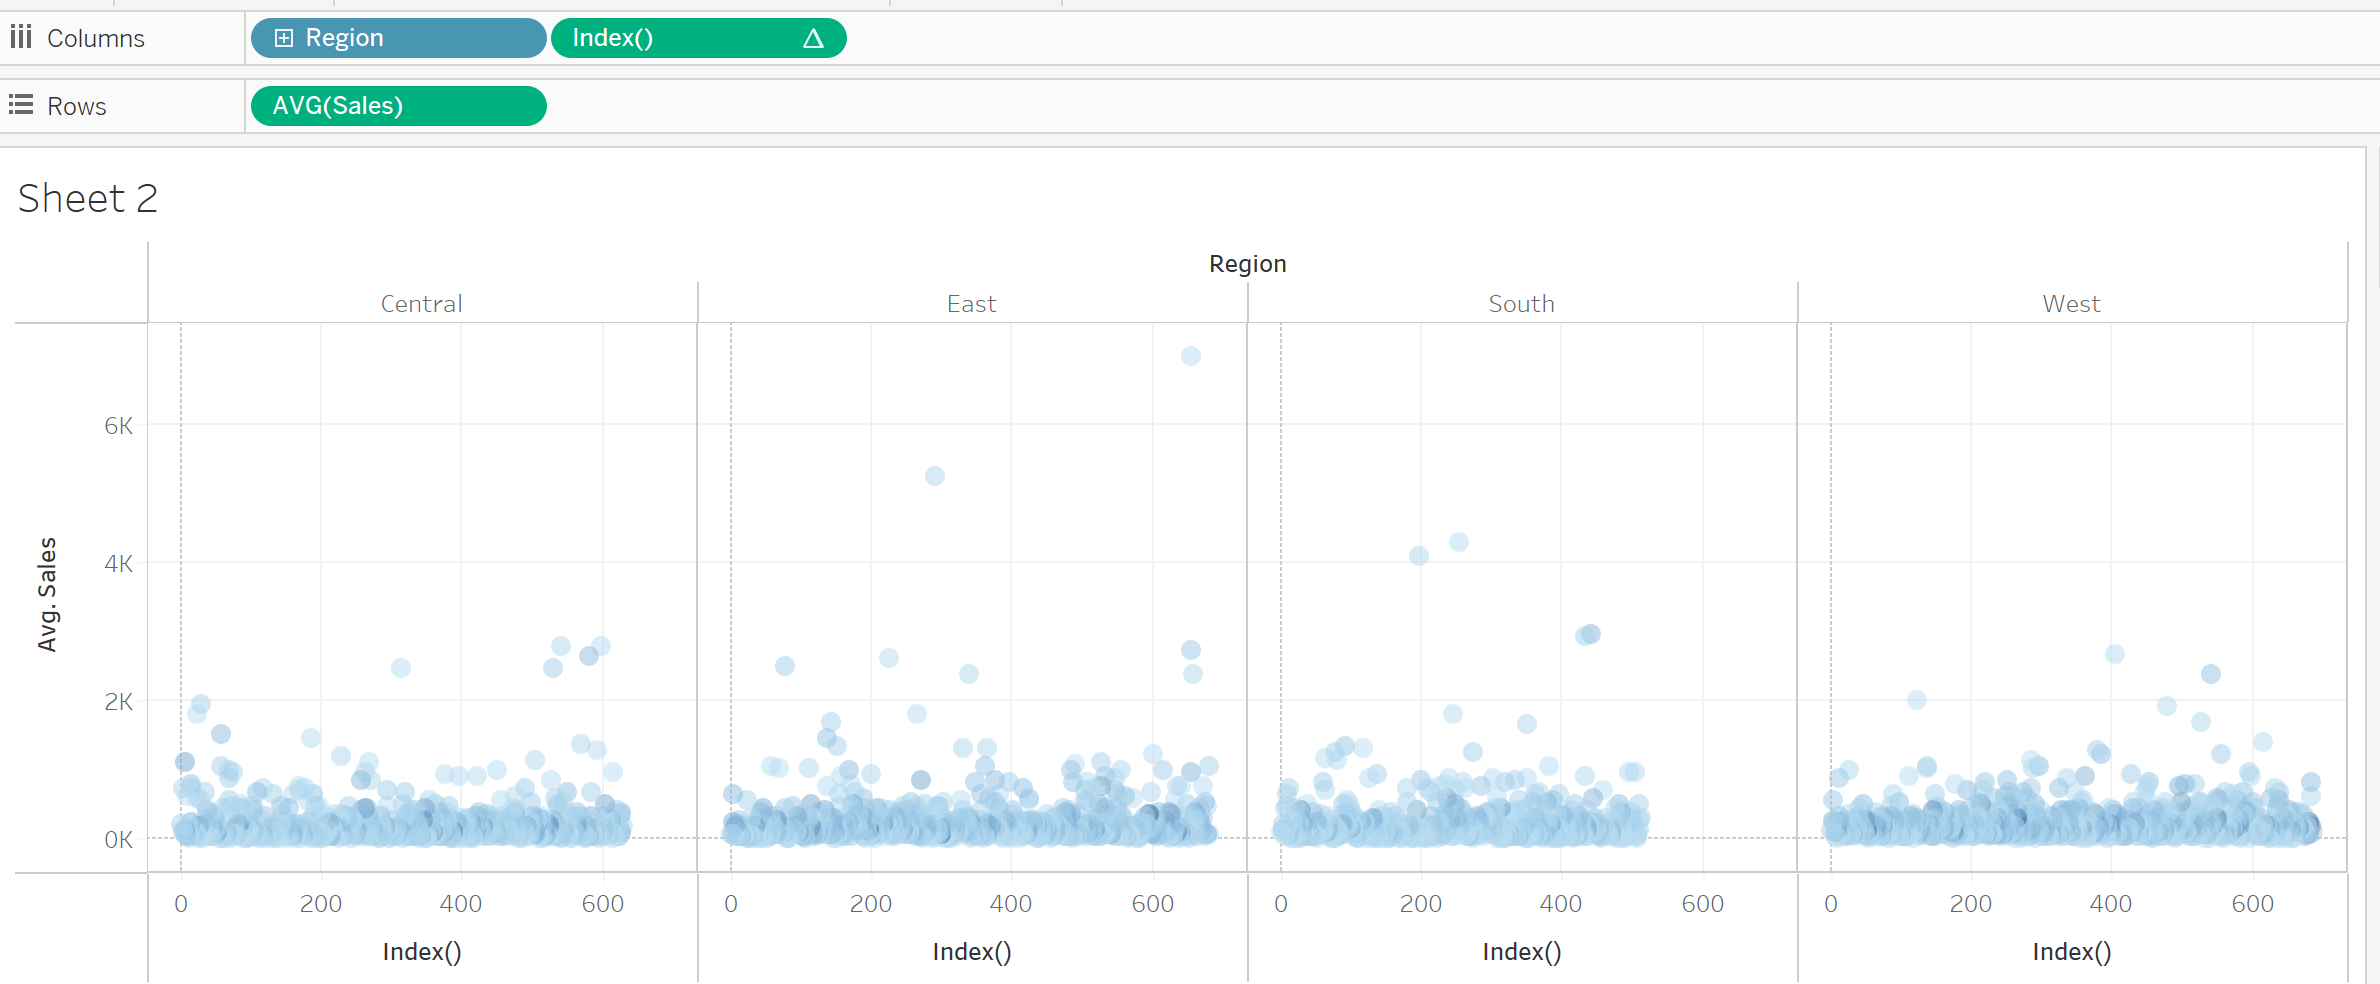
Index() similarly to the previous function, Index() is based on the position of the row in the data. It will give the row number of each rows going 1,2,3,4. A good use case for index is jittered charts. For example we have a chart with dots each representing a customer, the position of the dot represents the average sales for that customer. A lot of points will overlap, we can use Index() to give each dot a unique location on the X axis to make them more visible. This represents better the spread of the data as we now see that there are a lot of customers between 0 and 2k sales.

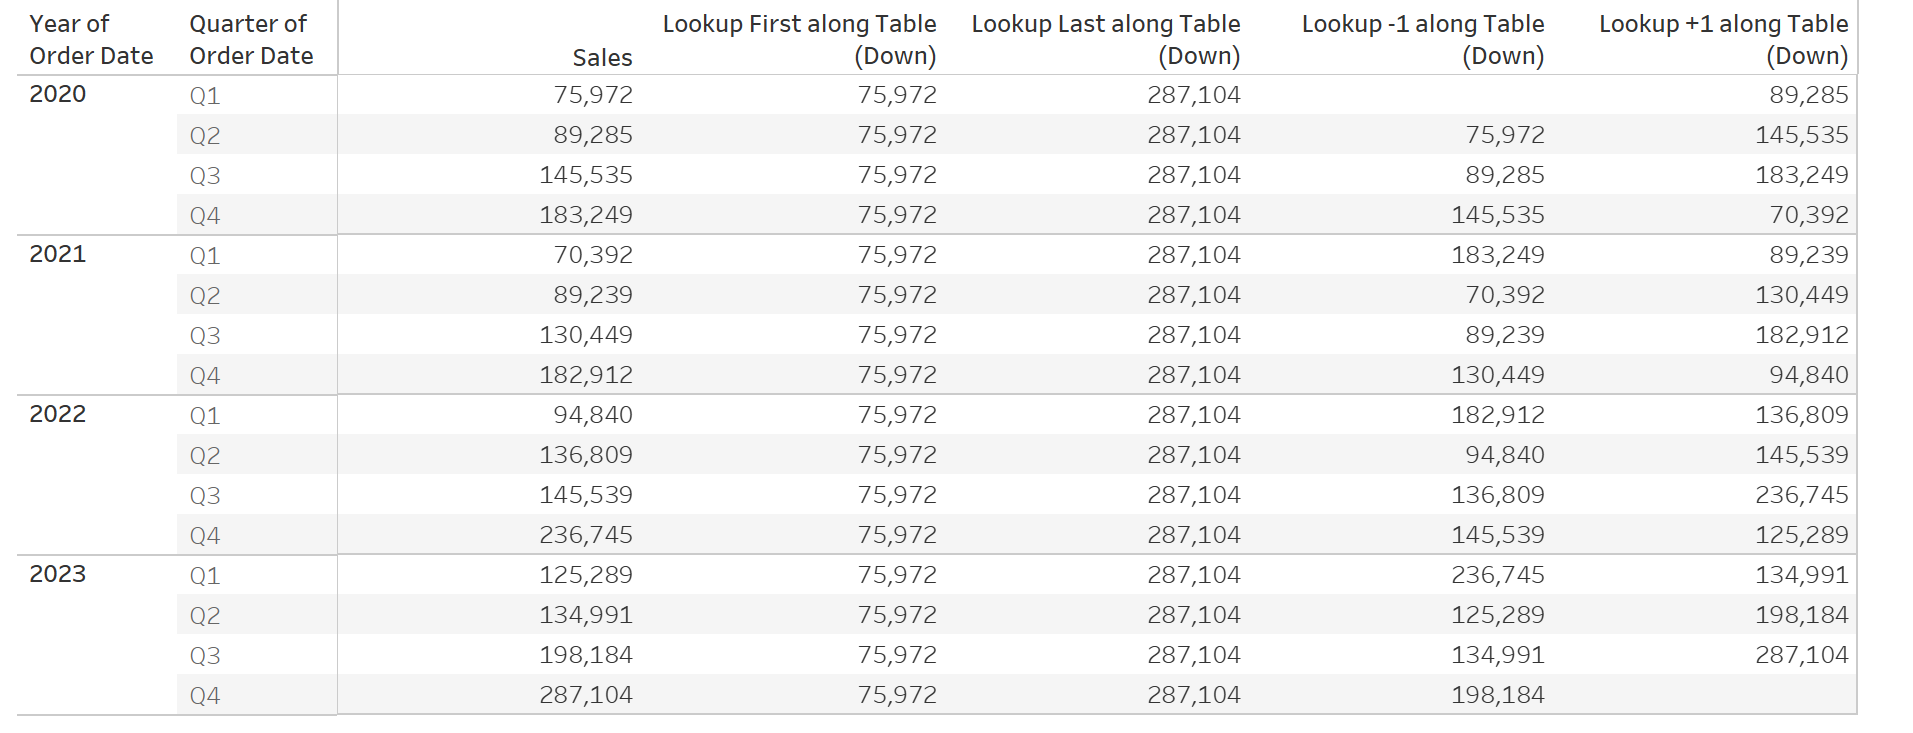
LOOKUP(Expression,Offset), this function returns the value of the expression for the row mentioned in offset. For example, Lookup(Sum(Sales), -1) will return the Sum of sales for the previous row. You can combine this with First or Last to get the first value in the data for example Lookup(Sum(Sales), First()). This leads to possibilities of comparing the current row to any row in the data.

These functions can be very useful, while they are tricky to use, I hope these examples will give you an idea of how to use them in your next visualisation!
