In this blog I will go through how to apply security to your dashboards. I will try to explain how to set up both column and row level security access. There are 2 different methods when setting up row level security, one using user filters and another via a security table. I aim to demonstrate both methods. Both CLS and RLS can be set up on a user group or an individual user basis. Some knowledge that might be useful to know before reading on is that you can set up user groups on the server and can switch roles to view what another user would see using the downward arrow by my name in the image below.

It can be useful to switch roles to test the security has been set up correctly and make sure that users are only seeing what they are permitted to, before distributing the dashboard on server.
Column Level Security
As you can probably gather from the name, this type of security gives you the ability to control which columns a user can access which in turn can control the filters they have access to too.
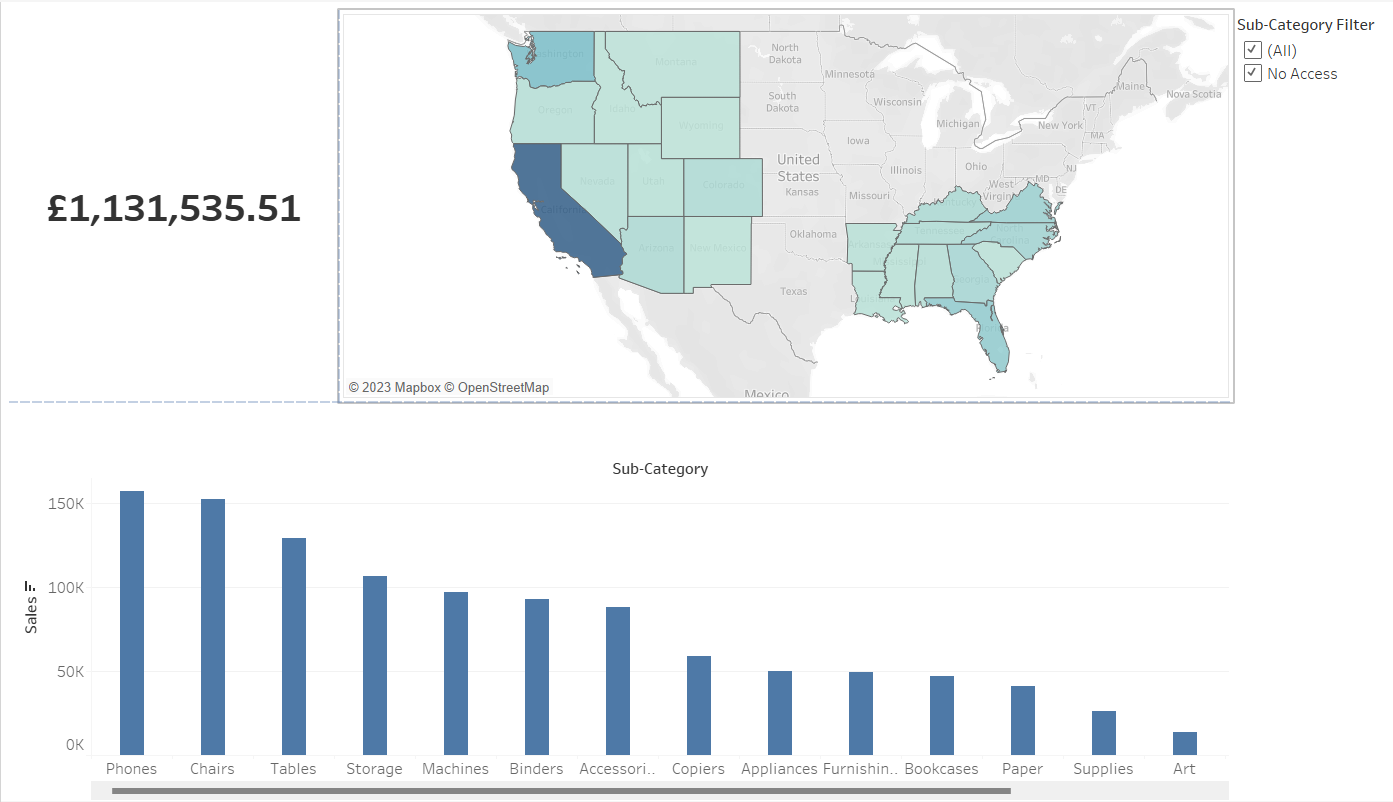
In the dashboard above you can see that I have restricted access to the sub category filter but the chart still remains. Below I have restricted access to both the filter and the chart and have added a message saying 'No Access' instead of having a blank space.
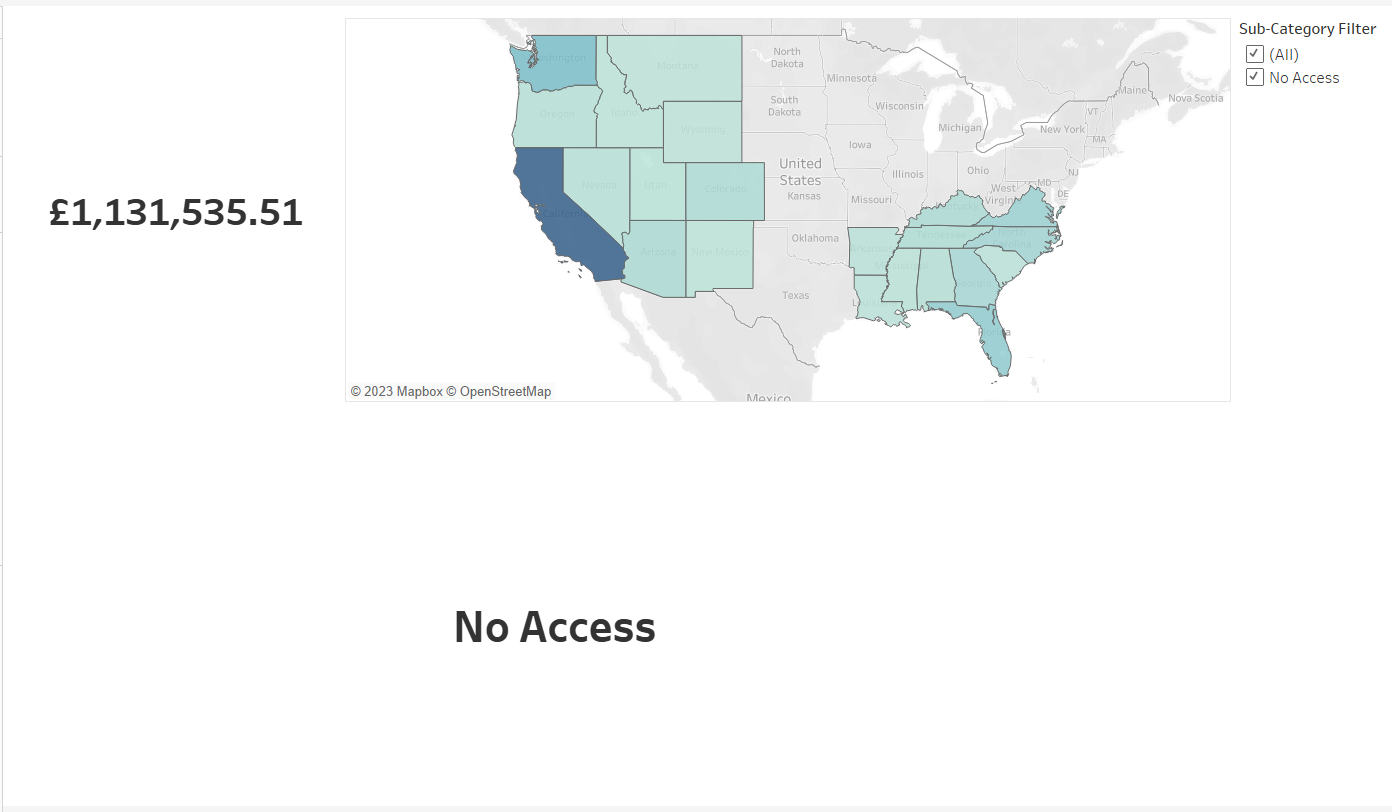
Set Up
As mentioned in the introduction, CLS can be set up for user groups or for individual users. I have set mine up using a security group.
My user group is called "Test". To restrict access to the sub-category filter I used this calculation:
if ISMEMBEROF('Test')
then 'No Access'
else [Sub-Category]
END
Here we are saying if the user is a member of the "Test" user group then they should not have access to the filter. If you would still like users in this group to have access to some charts that normally the "Sub Category" filter would apply to then make sure that the "No Access" option is ticked. Do this either by switching roles to a user in the "Test" group or select the "use all" option in the filter pop up. If you like to apply your CLS on an individual user basis then replace "ISMEMBEROF('Test')" with USERNAME() = (whatever their username is).
The logic behind the calculation used to erase the chart is very similar. First we want to create a sheet with the "No Access" message we want to appear in place of the chart and then create a filter using the calculation below:
ISMEMBEROF('Test')
Here we want to set this filter to "true" on our sheet with our "No Access" label. To set this up you will have to switch roles from yourself to someone who does not have access to the chart.
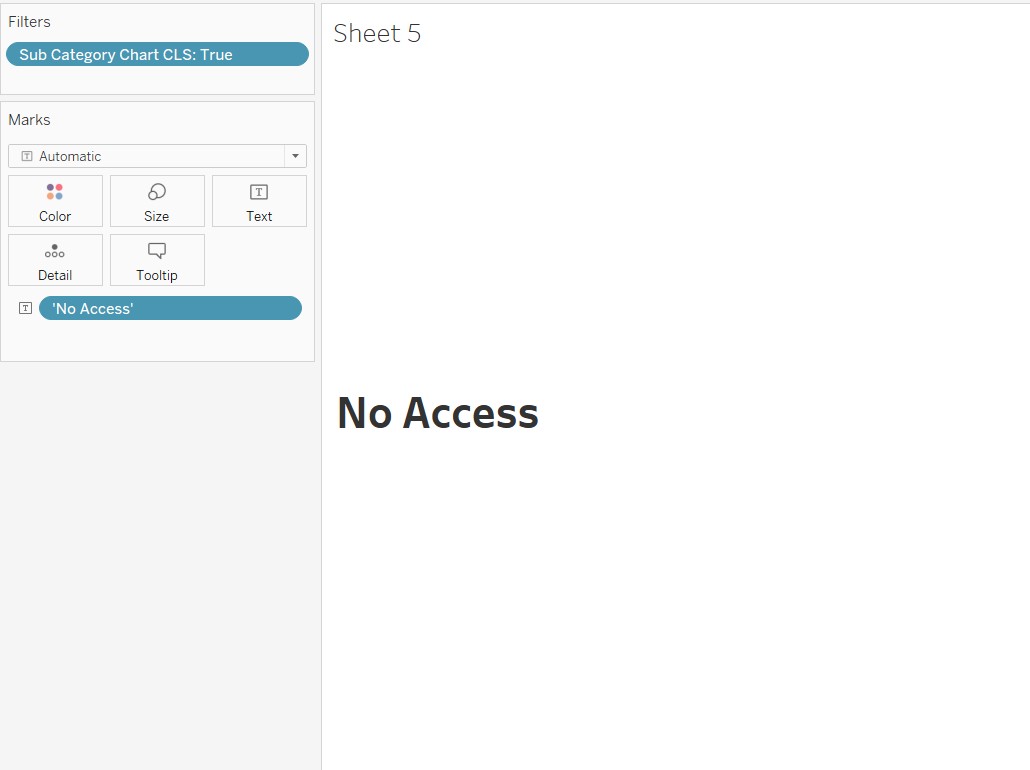
We want our filter to be "false" on the worksheet containing the chart. I would recommend adding this filter to context normally just to make sure that it happens first, before any other filters on the chart.
Add the sheet with the "No Access" message as floating object on your dashboard and set the shading to transparent.
Row Level Security
RLS gives you the functionality to control the rows that a user has access to. As I mentioned in the introduction, RLS can be set up using 2 different methods, one using a security table and another using user filters. I will first explain how to set up RLS using a security table.
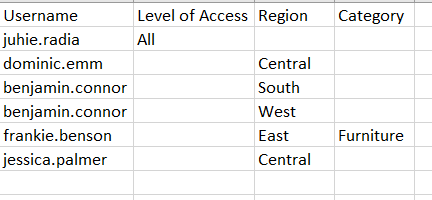
When creating this security table make sure that values are spelt correctly and are in the right case. I only want to control access to the "Region" and "Category" fields, so have only included those in my security table. The "Level of Access" column isn't used in any Tableau calculations but just useful for whoever updates the security table to be aware of those who have access to all of the data. The alternative would be to write "All" in the "Category" and "Region" columns instead of leaving them blank, it's just personal preference.
To set up RLS, join your security table to your main data set using the join calculation below:
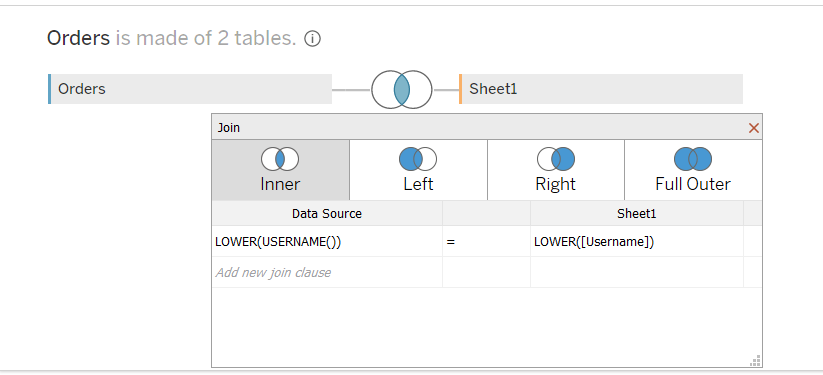
The reason I have wrapped the usernames in a lower() calculation is to make sure everything joins correctly and is in the same case. In a relationship the security table and the main data source are treated separately but in a join you essentially create one big data source. For this reason if you use a relationship instead of a join then it can sometimes cause some sheets to go blank because the security table is not being used to build any of the charts, so Tableau doesn't know where to pull the data from.
A data source filter then needs to be set up, exactly the same as the join calculation:
lower([Username]) = lower(USERNAME())
This filter should then be set to "true".
Since I am using my security table to restrict access to values in the "Category" and "Region" fields, I also need to set up similar RLS filters for each field. I have written the calculation for the "Region" field below, so set this up for the "Category" field I just exchanged "Region" for "Category".
ISNULL([Region (Sheet1)])
or [Region (Sheet1)] = [Region]
"Region (Sheet1)" is the category field in my security table.
Where there is no value in the "Region" column in my security table, it means that I have access to all of the Regions and should be able to see data for all of them. Where there is a specified value in the security table, I should only be able to view the data for the region specified. Make sure these are all data source filters, as you would like them to be applied first to control the access, according to the Order of Operations for Tableau.
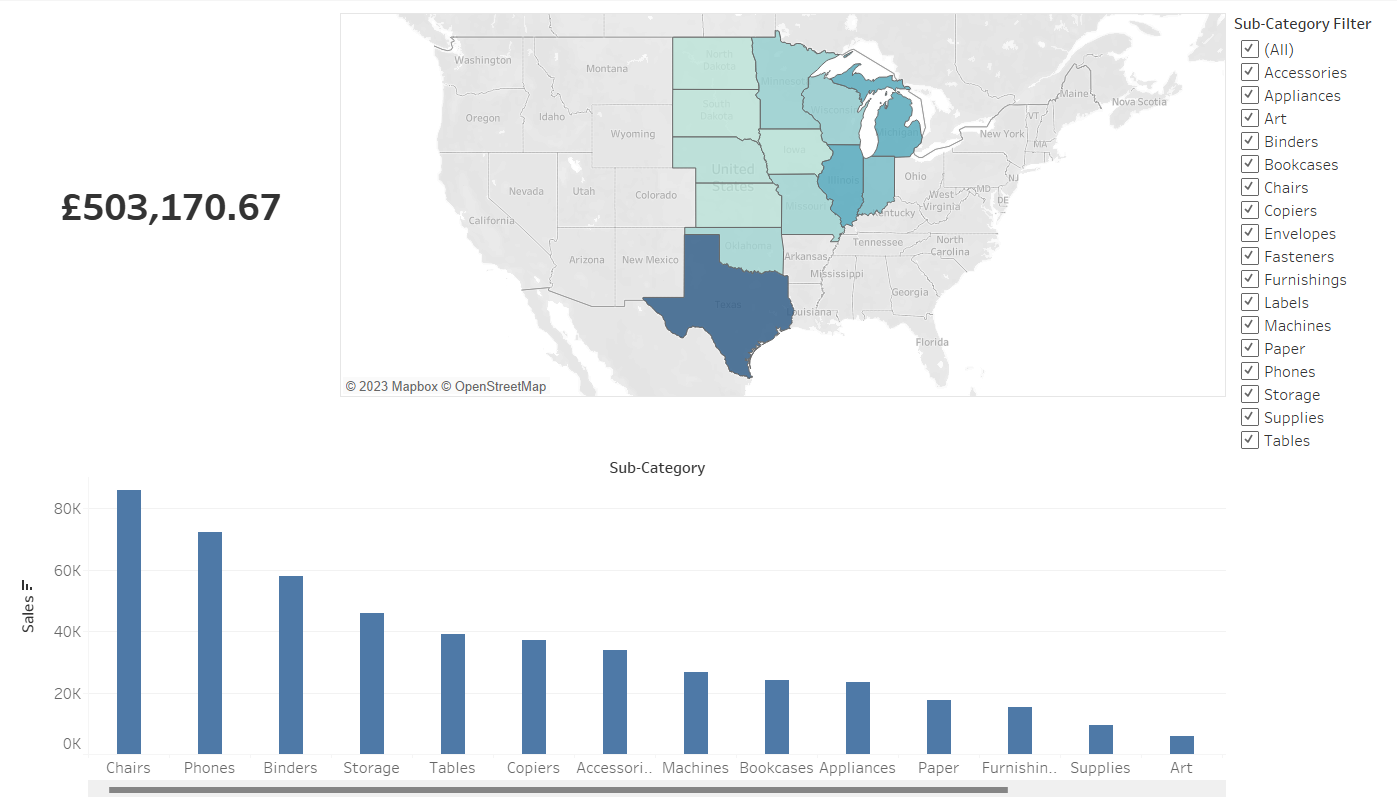
In my security table you can see that Dom only has access to the Central region. If I switch roles and now view my dashboard as if I was Dom, the view below is what he would see:
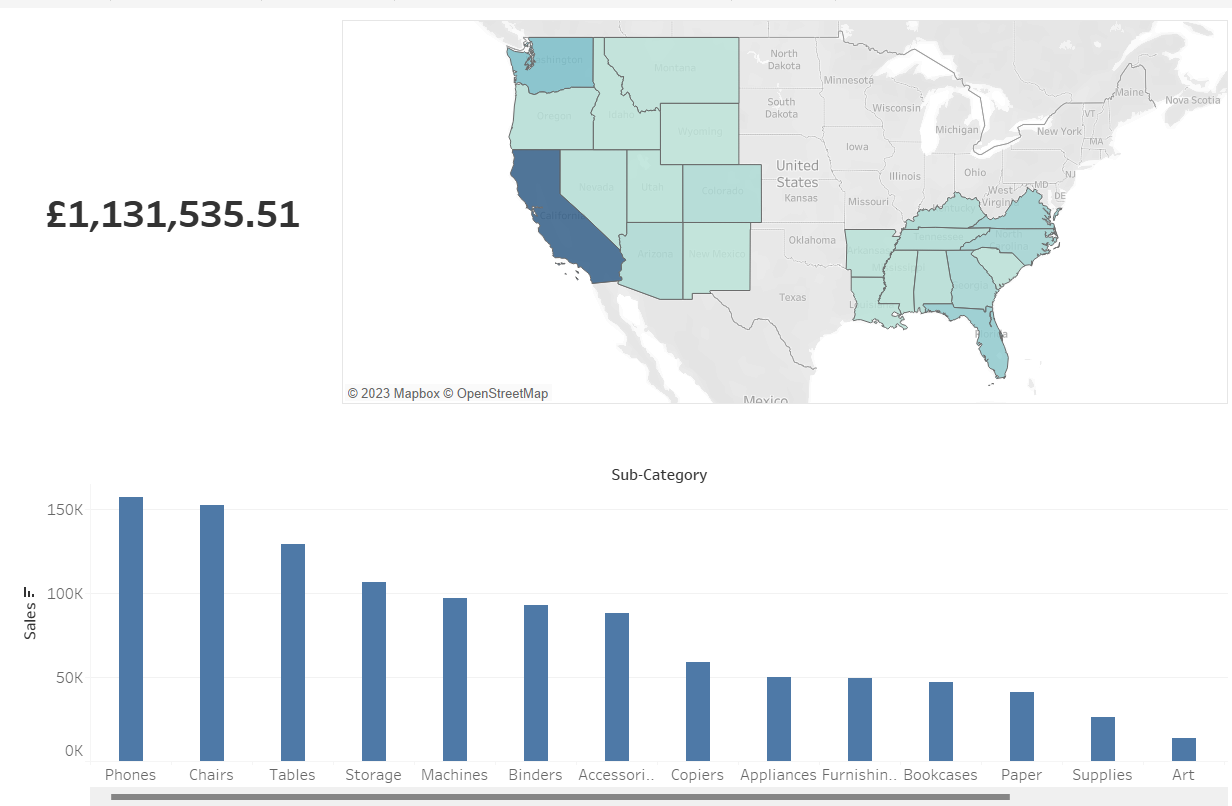
Ben has access to both the South and West regions and so appears twice in the security table because of this. The view Ben would see is below:
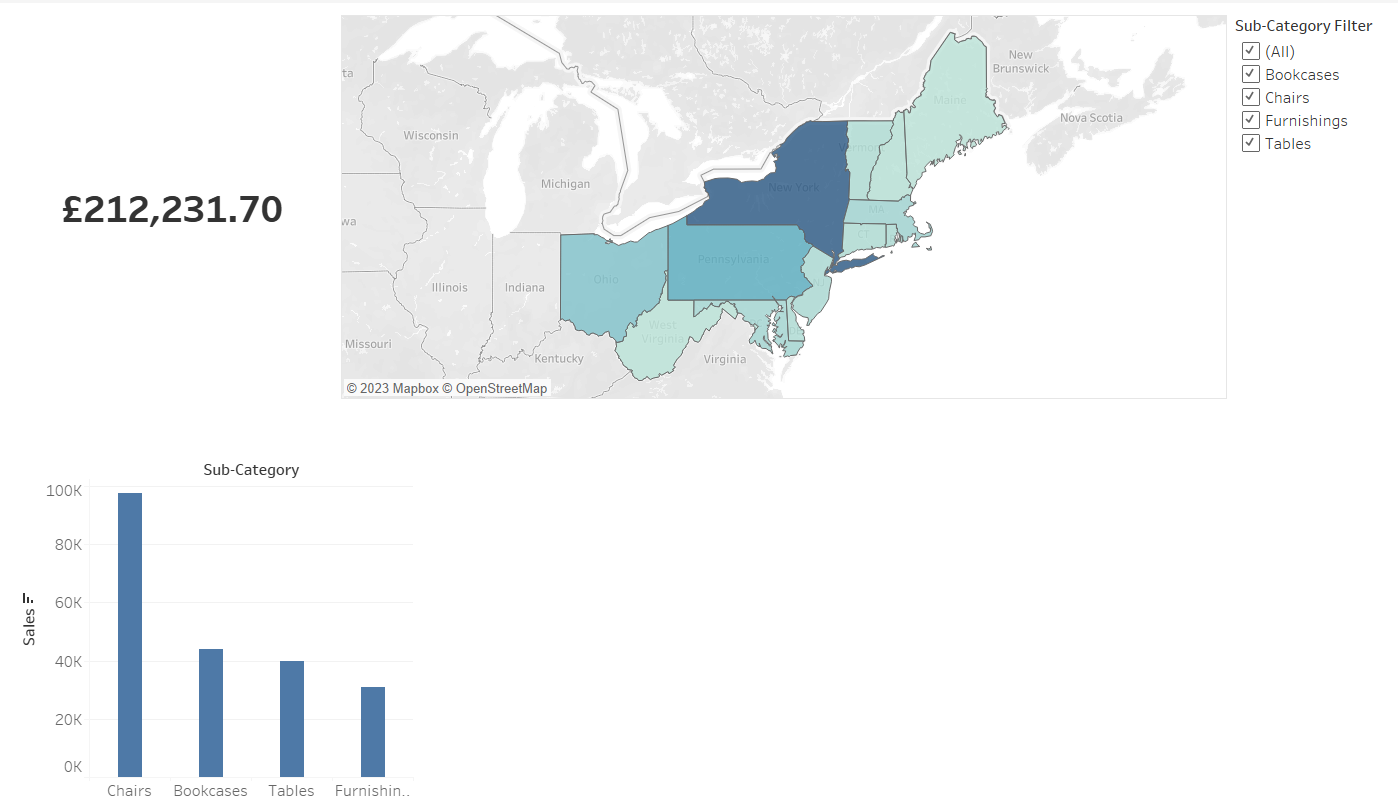
Frankie has access to data in the East Region but only data that is in the Furniture Category:
User Filters
User filters essentially do the same thing as a security table and allow you to control access on a row level.
To set this up, on a worksheet navigate to server > user filter and choose which ever column you would like your filter to be based on. In the pop up then choose the user group or user who's access you would like to control.
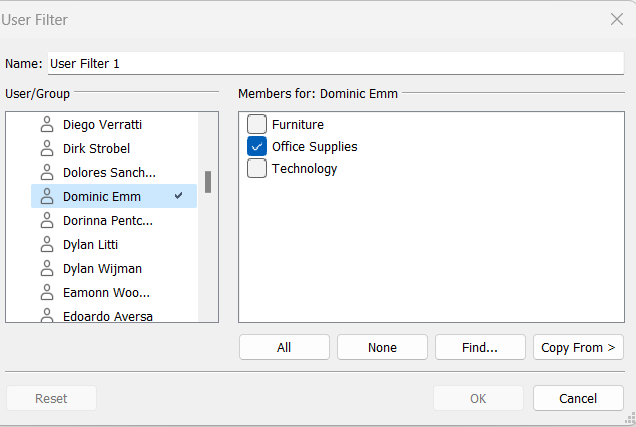
Here I am saying that I only want Dom to have access to the "Office Supplies" category.
A field, in my case called "User Filter 1", will be created and added to your data pane. This can then be dragged on to the filters shelf and applied to the relevant sheets.
Now Dom's view changes:
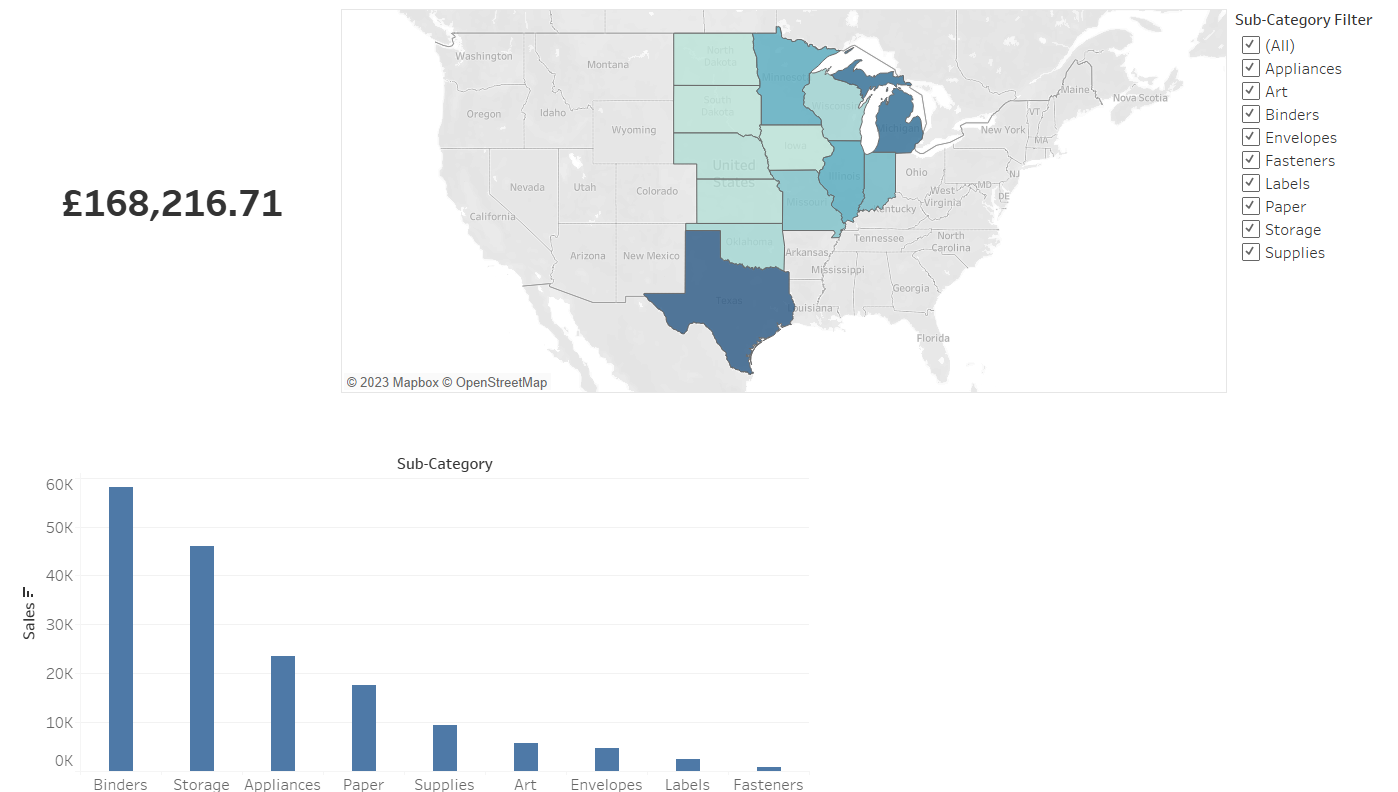
He now only sees those sub categories that have been categoried as office supplies and in line with the security table, he still only has access to the central region.
Comparison
- User filters can be applied to user groups created on server whereas a security table can only be applied on an individual user basis
- To update access on a user level, with a security table you would just need to refresh the data source in Tableau, after making the updates. With user filters you would have to open up the workbook and edit the access within Tableau itself. However, to update access on a user group level, you can just add a user to the group on server and they will be given the relevant permissions based on the group.
- If your dashboard is being used by numerous people with different levels of access, using the user filter method can get a little out of hand and I find that a security table can be easier in this case. User filters are usually best for dashboards that have a smaller audience.
General Access
If there are some users who should not have access to any of the dashboard then you can set up a message, similar to before, saying that they have "No Access" rather than just presenting them with a blank sheet. The logic and set up of this, is pretty much the same as earlier but now applied to all of the charts in your dashboard.
I have set this up using user groups but again you can also do this on an individual user basis.
I have created a sheet with my message, "No Access" and a filter with the calculation:
NOT ISMEMBEROF('Test')
So when the filter is set to "false" (the user is a member of the "Test" user group) then the sheet would go blank as they have access, so you don't want the "No Access" message to appear.
When the filter is set to "true" (the user is not in the "Test" user group) the "No Access" message will appear.
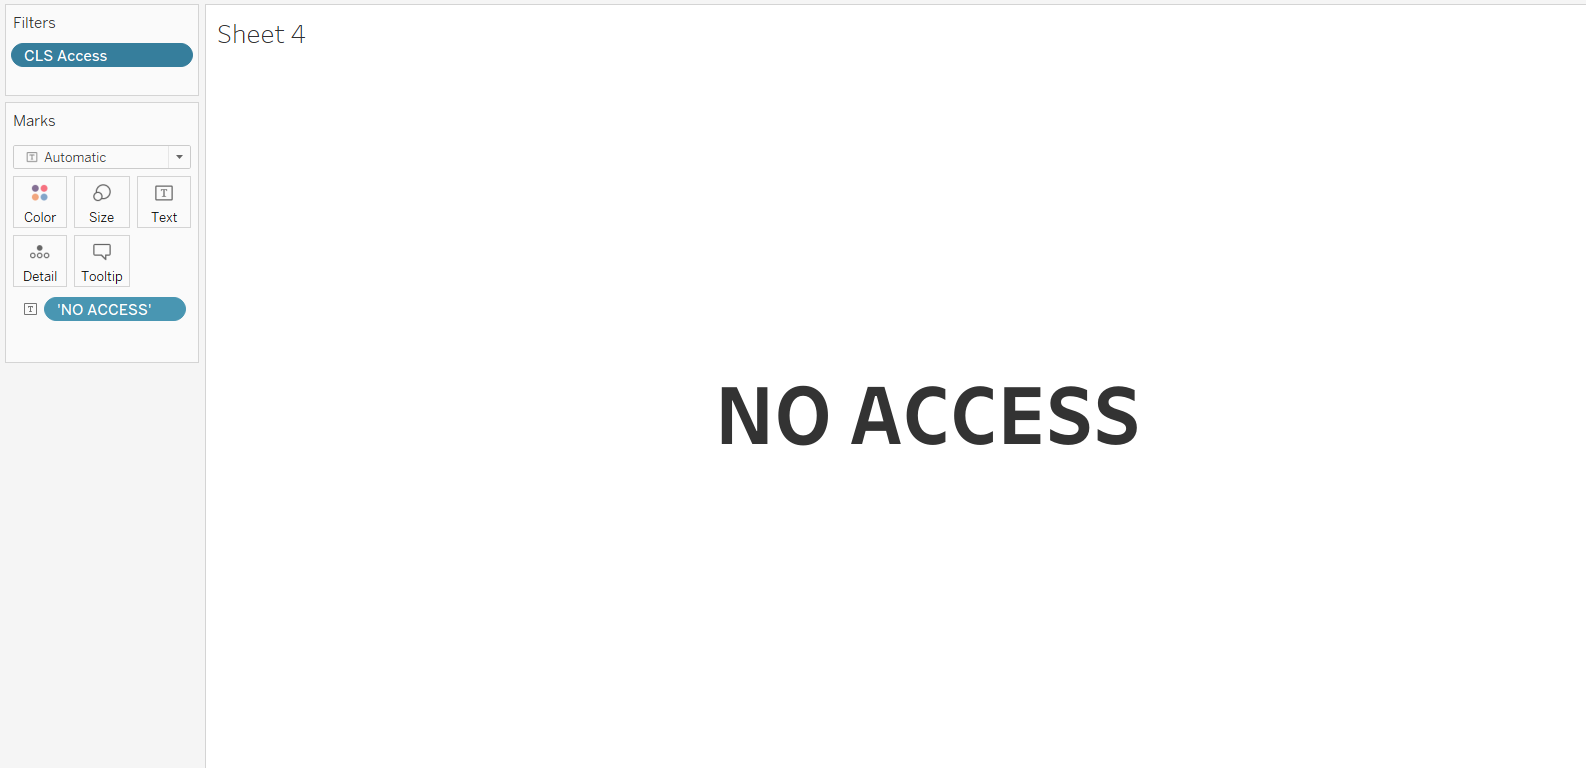
If you have multiple user groups, with different permissions, who should all have access to the dashboard, then you can either create a calculation capturing all of the user groups, with all the users who should have access, using an "and" clause like below:
NOT ISMEMBEROF('Test')
AND
NOT ISMEMBEROF('Test 2')
Or you can have one main user group with everyone who has access to the dashboard and create sub user groups with the different access levels. In this case you would only need to restrict access to one overall user group with all the users.
Drag this sheet with the message on to your dashboard as a floating object and set the floating order to 'send to back', make sure the shading is also set to transparent.
Once you have created your access to all filter, add this filter to the sheets of your dashboard that you would like to hide. I would recommend adding it to context as you would like this filter to happen first, according to the Order of Operations in Tableau. This filter should be set to "false", as those users who are included in the "Test" user group should have access to the charts. This filter can then be applied to all the relevant sheets.
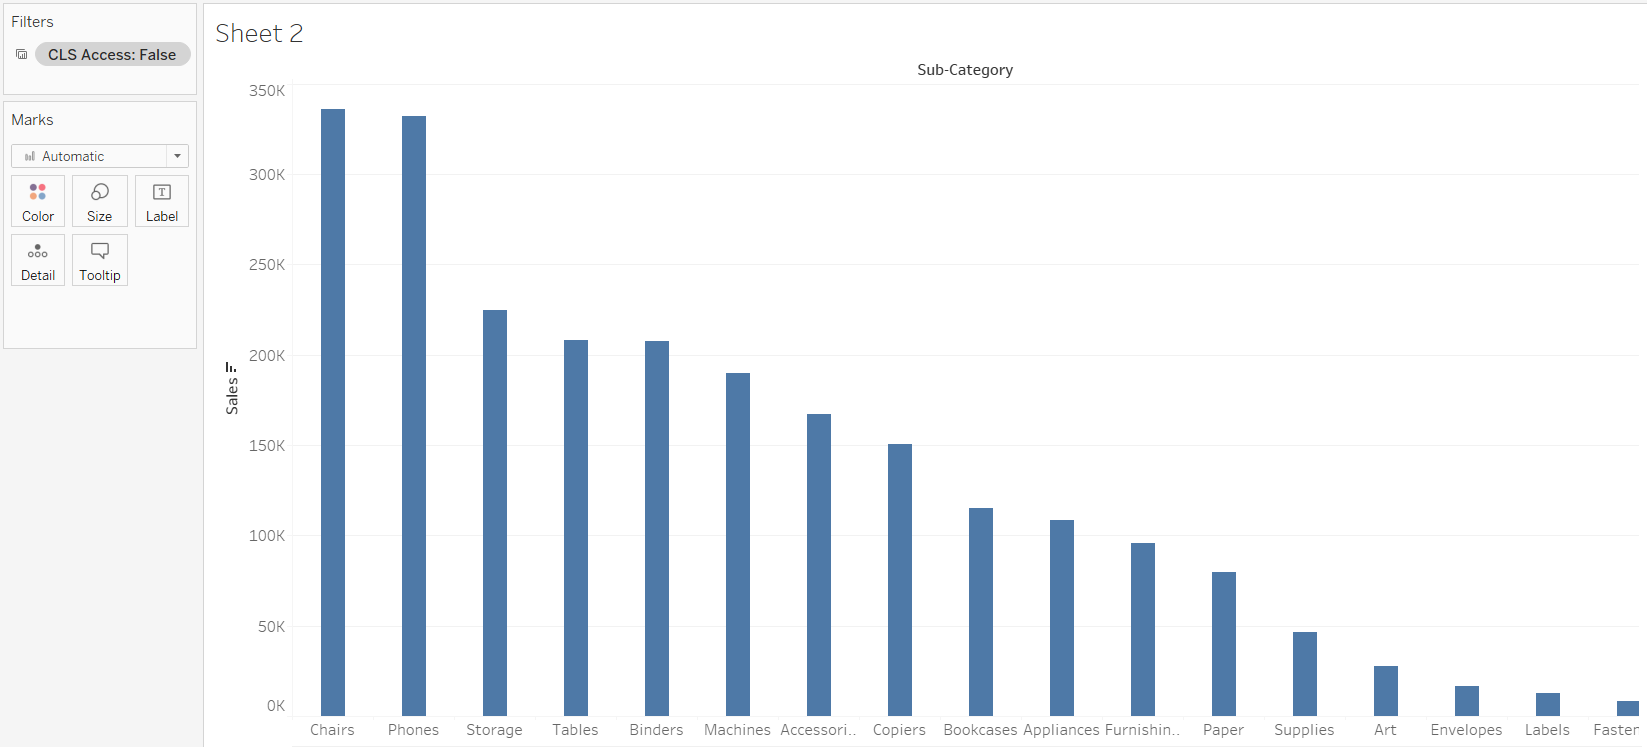
For those who have access to the dashboard, they will see the below:

For those who don't have access to the dashboard, they will see the message we created instead and all of the charts and filters will be blank:
Just to summarise the last few steps, the access filter should be set to "true" on the message sheet but "false" on all of the charts.
I hope this blog has been useful and helped you to set up the security on your dashboards. :)
