


I've been loving the recent Premier League game data available on Makeover Monday (Week 22). As a football fan, the dataset is a goldmine. As an Arsenal fan, I've been itching to visualise the team's title winning season. A bit of digging led me to the chord diagram extension in Tableau, so I decided to put it to the test. Below is the steps I took to create the visual.
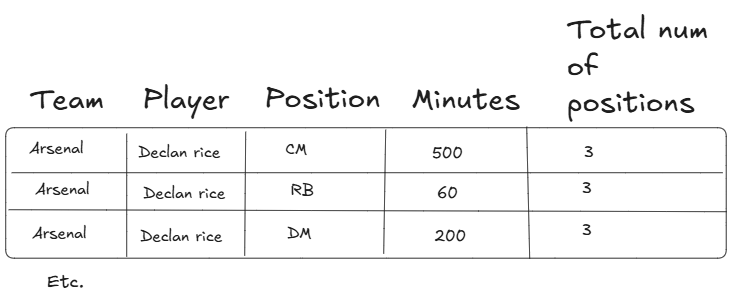
What data I wanted
Understanding the current data
The dataset is rich, with plenty of detail. Each row focuses on a specific game, along with individual player statistics for that match. Looking at the data I wanted to create, I only needed a granularity of team > player > position.
Digging deeper, it became clear that for each game ID, every player is assigned the position they played and the number of minutes they played in it.
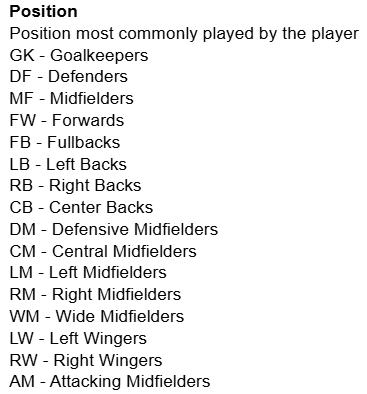
Finally, a trip to FBref (where the makeover monday data was sourced) helped me find out what all the position abbreviations actually meant.
Reshaping the data in Tableau Prep

Summary of the steps:
- Removed fields I didn't need
- Split the flow into parallel branches
- Aggregated the distinct count of positions played for each player
- Aggregated sum of minutes played per position per player
- Joined the two datasets together into one (join clause: player = player)
- The output was now in exactly the shape I outlined at the start
Using the chord diagram extension to visualise the data in Tableau Desktop
I used position/player for the source and target, and SUM(Minutes) for the size. This means that when a player or position is selected, you can see exactly how many minutes that player totaled up in each position. Since this round was all about Arsenal, I added Team as a filter and selected Arsenal only. Finally, the tooltip shows the exact amount of minutes the player played in that position.
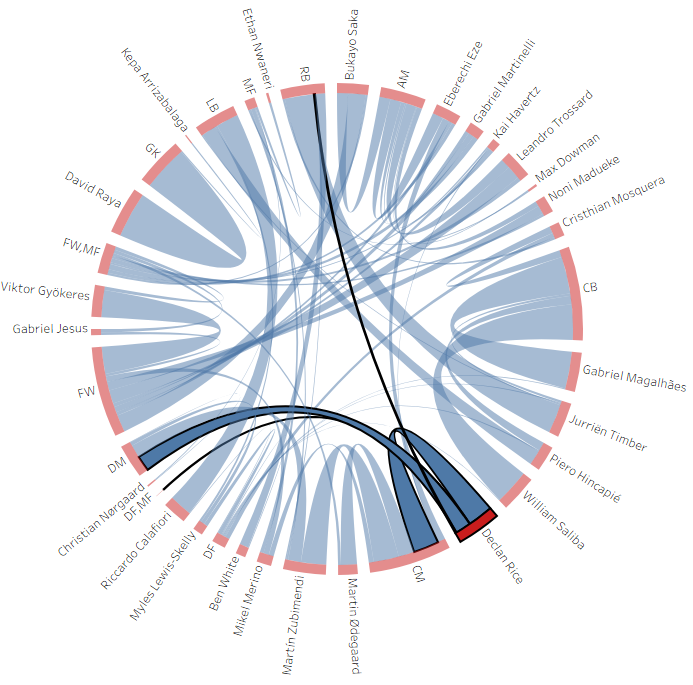
I'm really pleased with how the graph turned out. I'm already planning a bigger piece of Arsenal 25/26 season analysis, so watch this space!