Project and Brief
For this project, I was creating a dashboards in Power BI for PitchSide Pro. The brief for these dashboards was to focus on what is driving changes in revenue performance over time and what should the business focus on next to sustain growth?
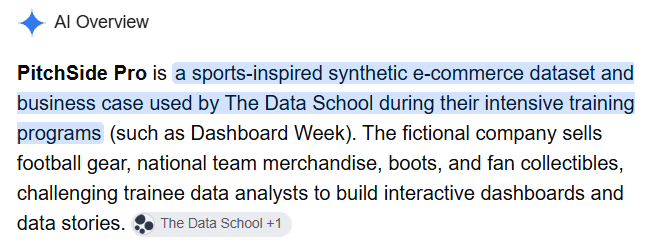
Here is a summary given by Google AI into who PitchSide Pro are:
This project was not for dashboard week, but ‘two days of fun’ - Robbin Vernooij
The Plan
Day 1:
- Read through brief
- Understand the data: Creating data dictionary and identifying granularity
- Scope: Business questions / User Stories / Key metrics / Stakeholder questions
- Call with stakeholder: Ask questions about the brief/data and confirm scope/business questions of the project
- Mood board creation: Colour schemes / chart ideas
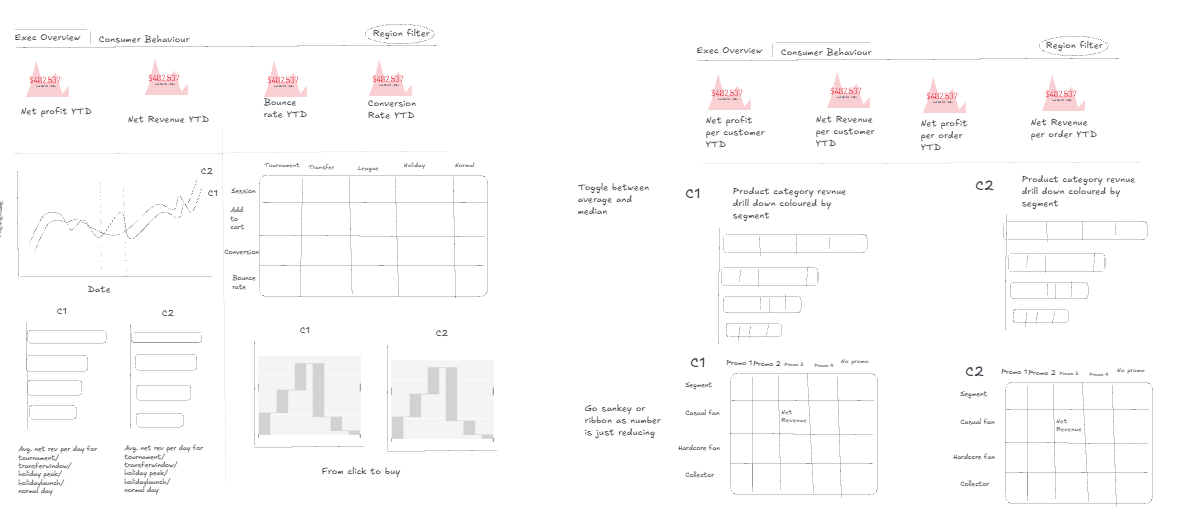
- Excalidraw sketching
- Create the data model in Power BI
- Call with stakeholder: Present sketch and data model for feedback and adjustments
- Adopt feedback, plan the following day and set up Power BI environment (measure table/date table)
- Prepare an transform any data in power query if required
Day 2:
- Build Power BI dashboard graphs, KPIs and functionality
- Format dashboards
- Write up this blog
- Record 5 minute presentation running through stories in the data whilst naturally demonstrating functionality.
Excalidraw sketch