Spatial data is the key to understanding the "where" and "why" things happen. It transforms abstract numbers into tangible, actionable insights by grounding information in a specific location.
What is Spatial Data?
Spatial Data is information associated with a specific location on the Earth's surface. This includes coordinates, addresses, boundaries, and physical features such as mountains, rivers and cities. Often represented through maps, graphs or digital databases to enable analysis, visualisation and understanding of geographical relationships and patterns.
Spatial Objects
- Point: single point defined by coordinates
- Line: single line defined by two sets of coordinates, one for each end
- Polyline: single line defined by multiple sets of coordinates
- Polygon: shape with any number of sides, defined by different coordinates along the lines
Spatial Analytics
Spatial Analytics is the process of analysing spatial data to gain insights, identify patterns and make informed decisions about geographic phenomena to understand the "where" and "why" things happen. It can involve applying statistical methods to understand spatial patterns, such as clustering, interpolation, overlay analysis and network analysis. Example methods include:
- Geostatistics: using spatial techniques to analyse spatial autocorrelation (the measure of how the value of a variable at one location is related to the values at nearby locations), spatial regression (analysing data points by accounting for their geographic location and the relationships between them), and spatial interpolation (estimating values at unknown locations based on values at known, scattered points).
- Predictive modelling: developing models to forecast future geographical trends or outcomes based on historical data and spatial relationships (e.g. predicting the spread of disease or future population density).
- Decision support: using spatial analytics to support decision-making processes in various domains, including urban planning, natural resource management, transportation, and public health.
Tool Comparison
While all three tools can visualise maps, they each specialize in different aspects of spatial analysis.
| Power BI | Tableau | Alteryx |
|---|---|---|
| Visualise Spatial Data - Limited to 3000-6000 marks | Visualise Spatial Data - Multiple Map Layers - Unlimited Marks | Create Points |
| Drive Time-Analysis | Routes (Lines) | Builds Polygons |
| Routes | Spatial Calculations (Distance, Buffer, Outline, Area, Intersects, Length) | Spatial Info |
| Distance | Spatial Joins | Spatial Match |
| Reads Spatial Data | Find Nearest | |
| Distance | ||
| Trade Area | ||
| Splits Polygons |
Power BI
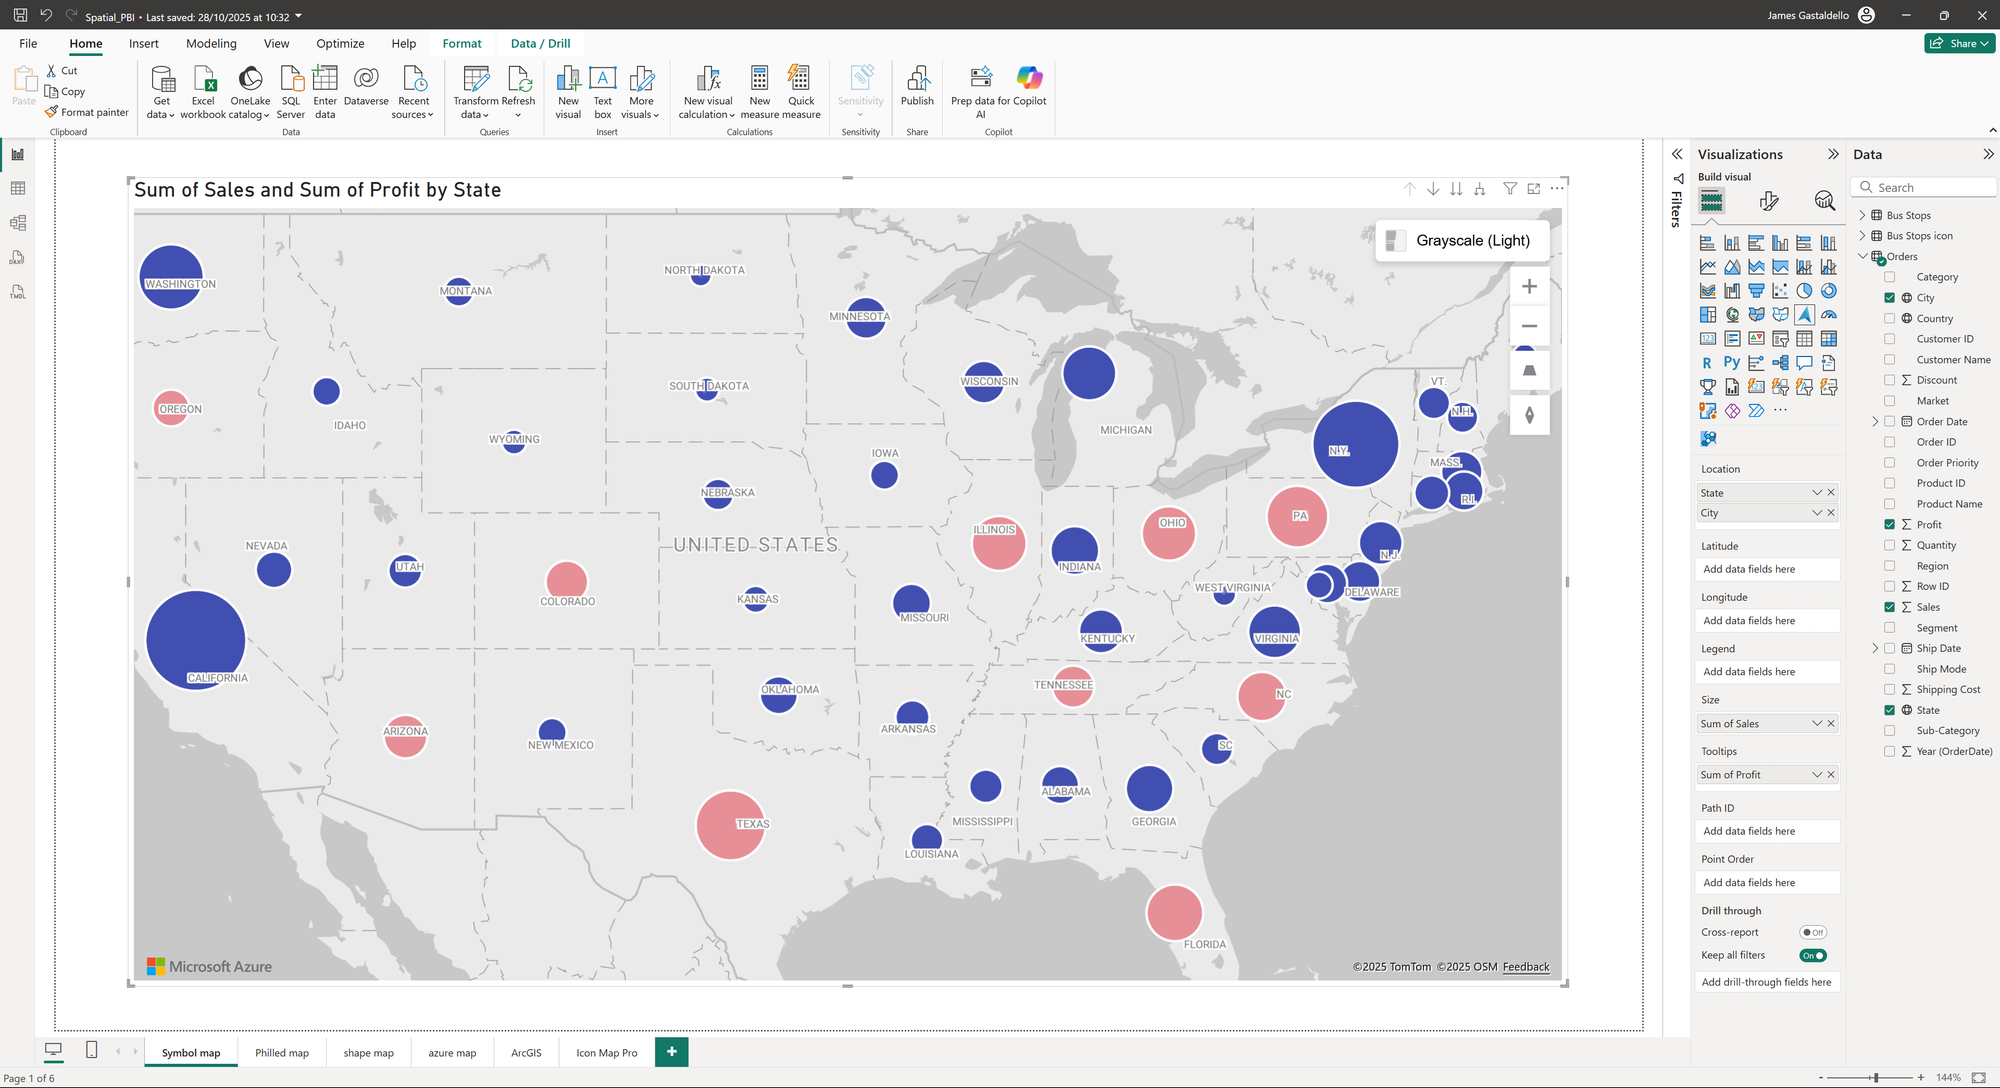
Power BI's core strength is visualisation and leveraging external services.
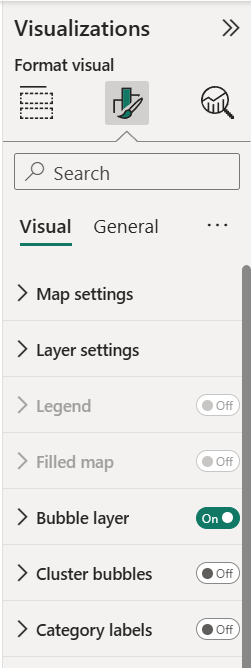
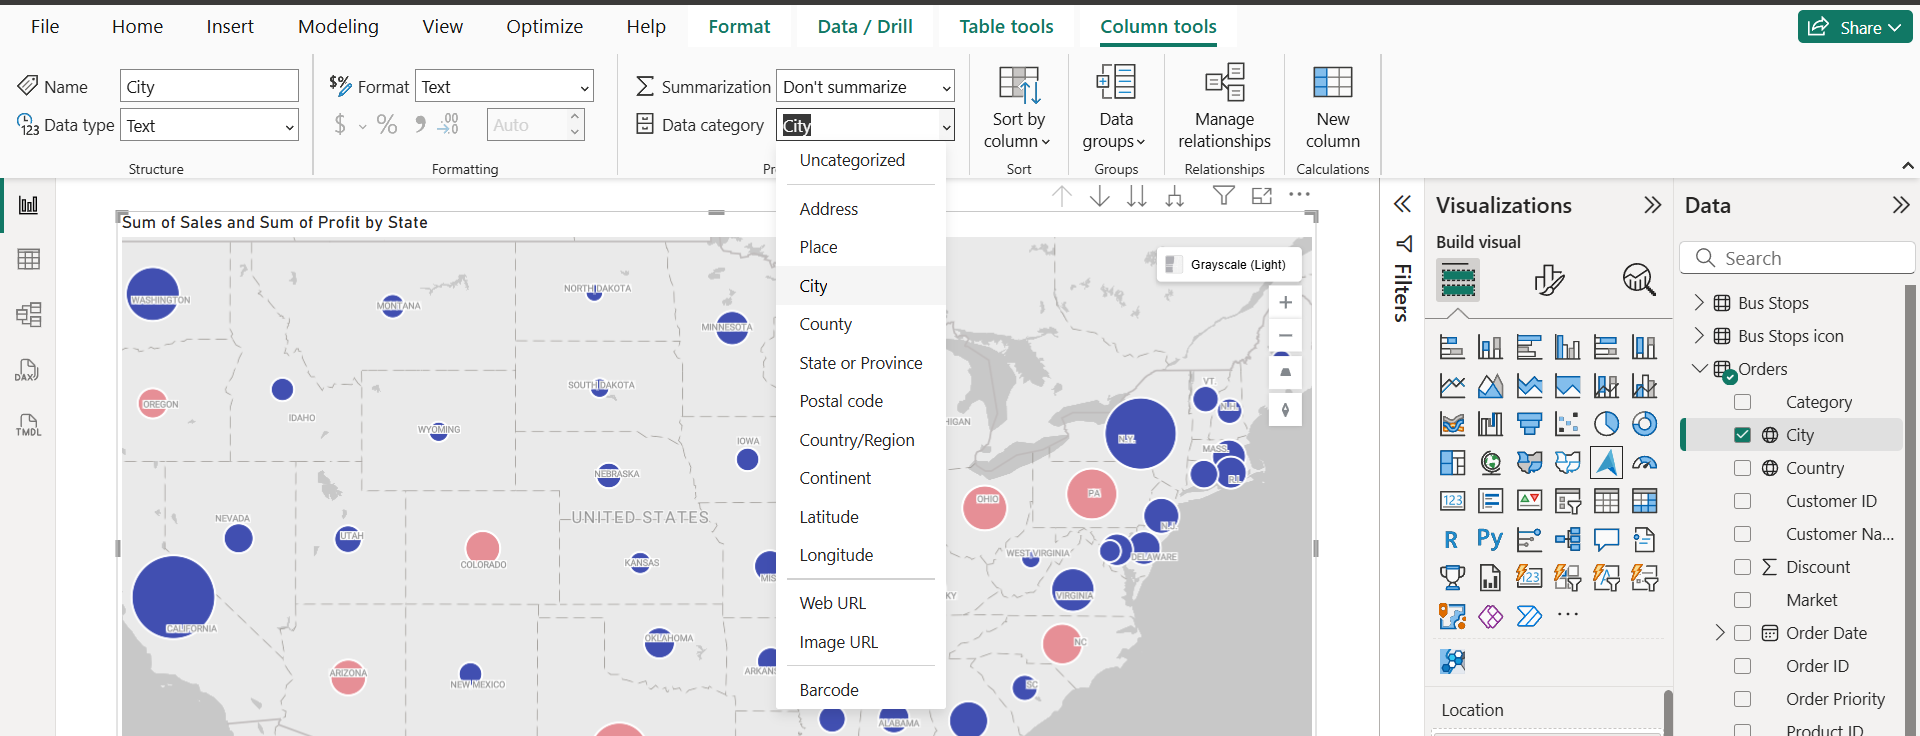
- Native Map Visuals: Power BI is capable of basic visualisation like the Azure Bubble Layer Map. To work, ensure that fields like "City" and "State" are assigned the correct Data Category within the data pane. Profit can be displayed using conditional formatting on the bubble color. (see below)
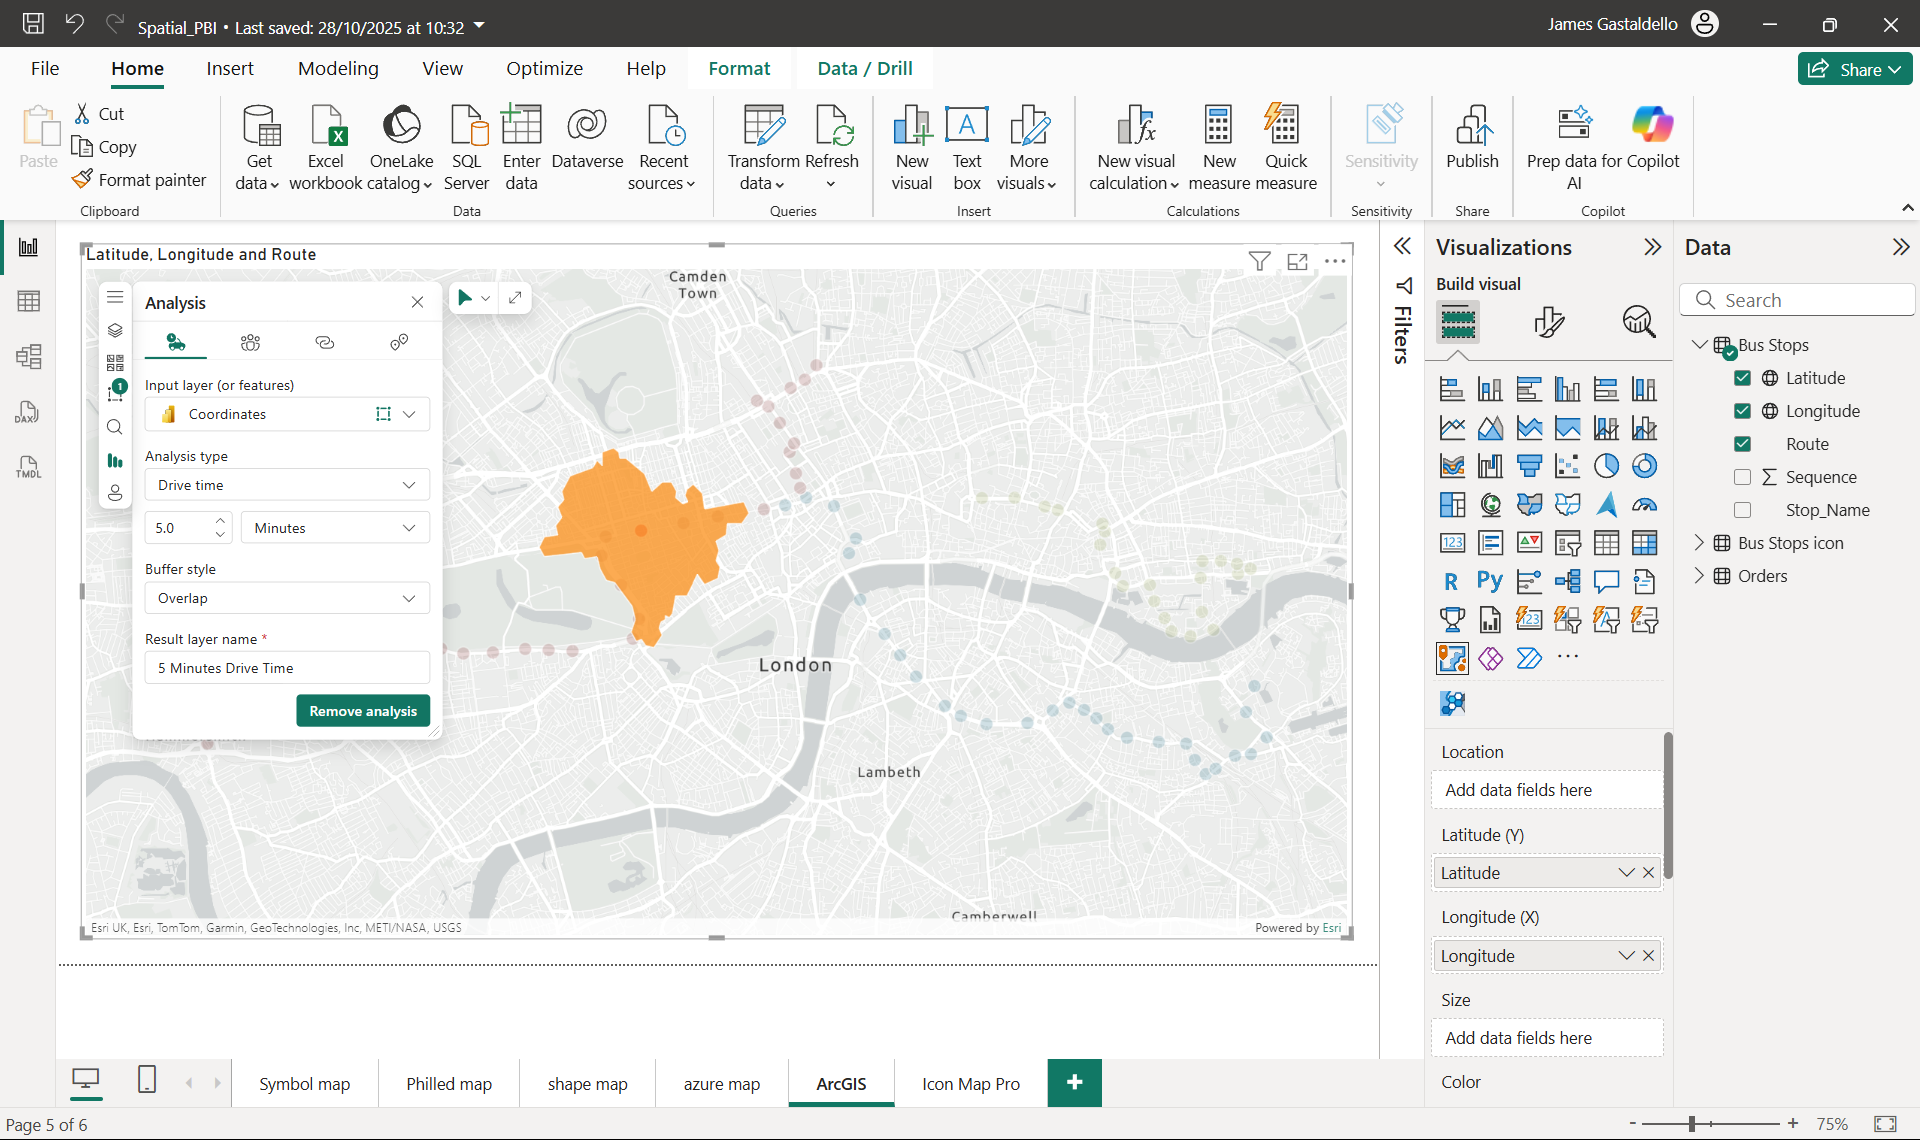
- Advanced Features: Integration with ArcGIS enables more complex analysis, such as Drive-Time Analysis. External custom visuals, like Icon Map Pro, can also expand capabilities. (see ArcGIS drive time analysis below)
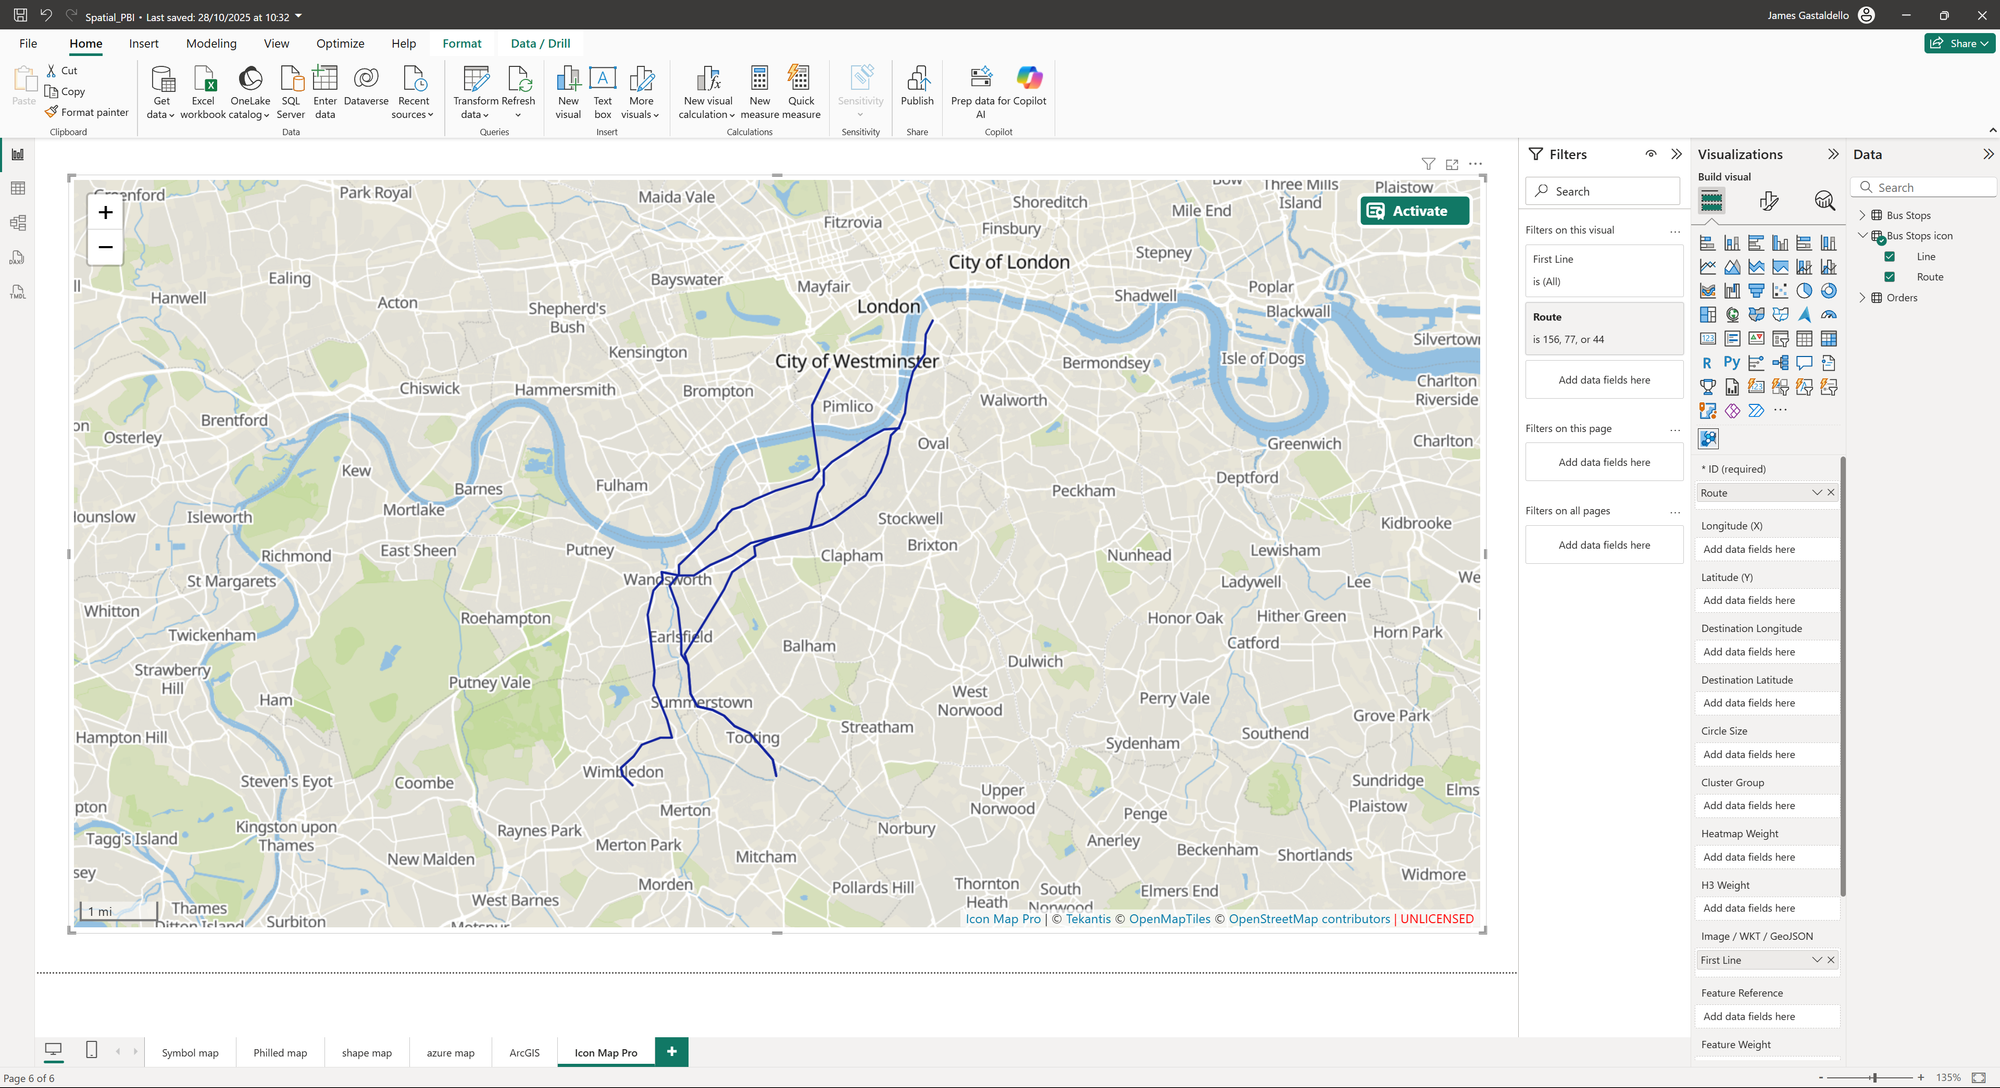
(see Icon Map Pro below)
Tableau
Tableau is optimised for interactive visualisation and provides a robust set of built-in functions for geospatial analysis.
Key functions:
- MakePoint: Generate spatial object constructed from latitude and longitude or a spatial object when constructed from an x-coordinate, y-coordinate and SRID (spatial reference identifier).
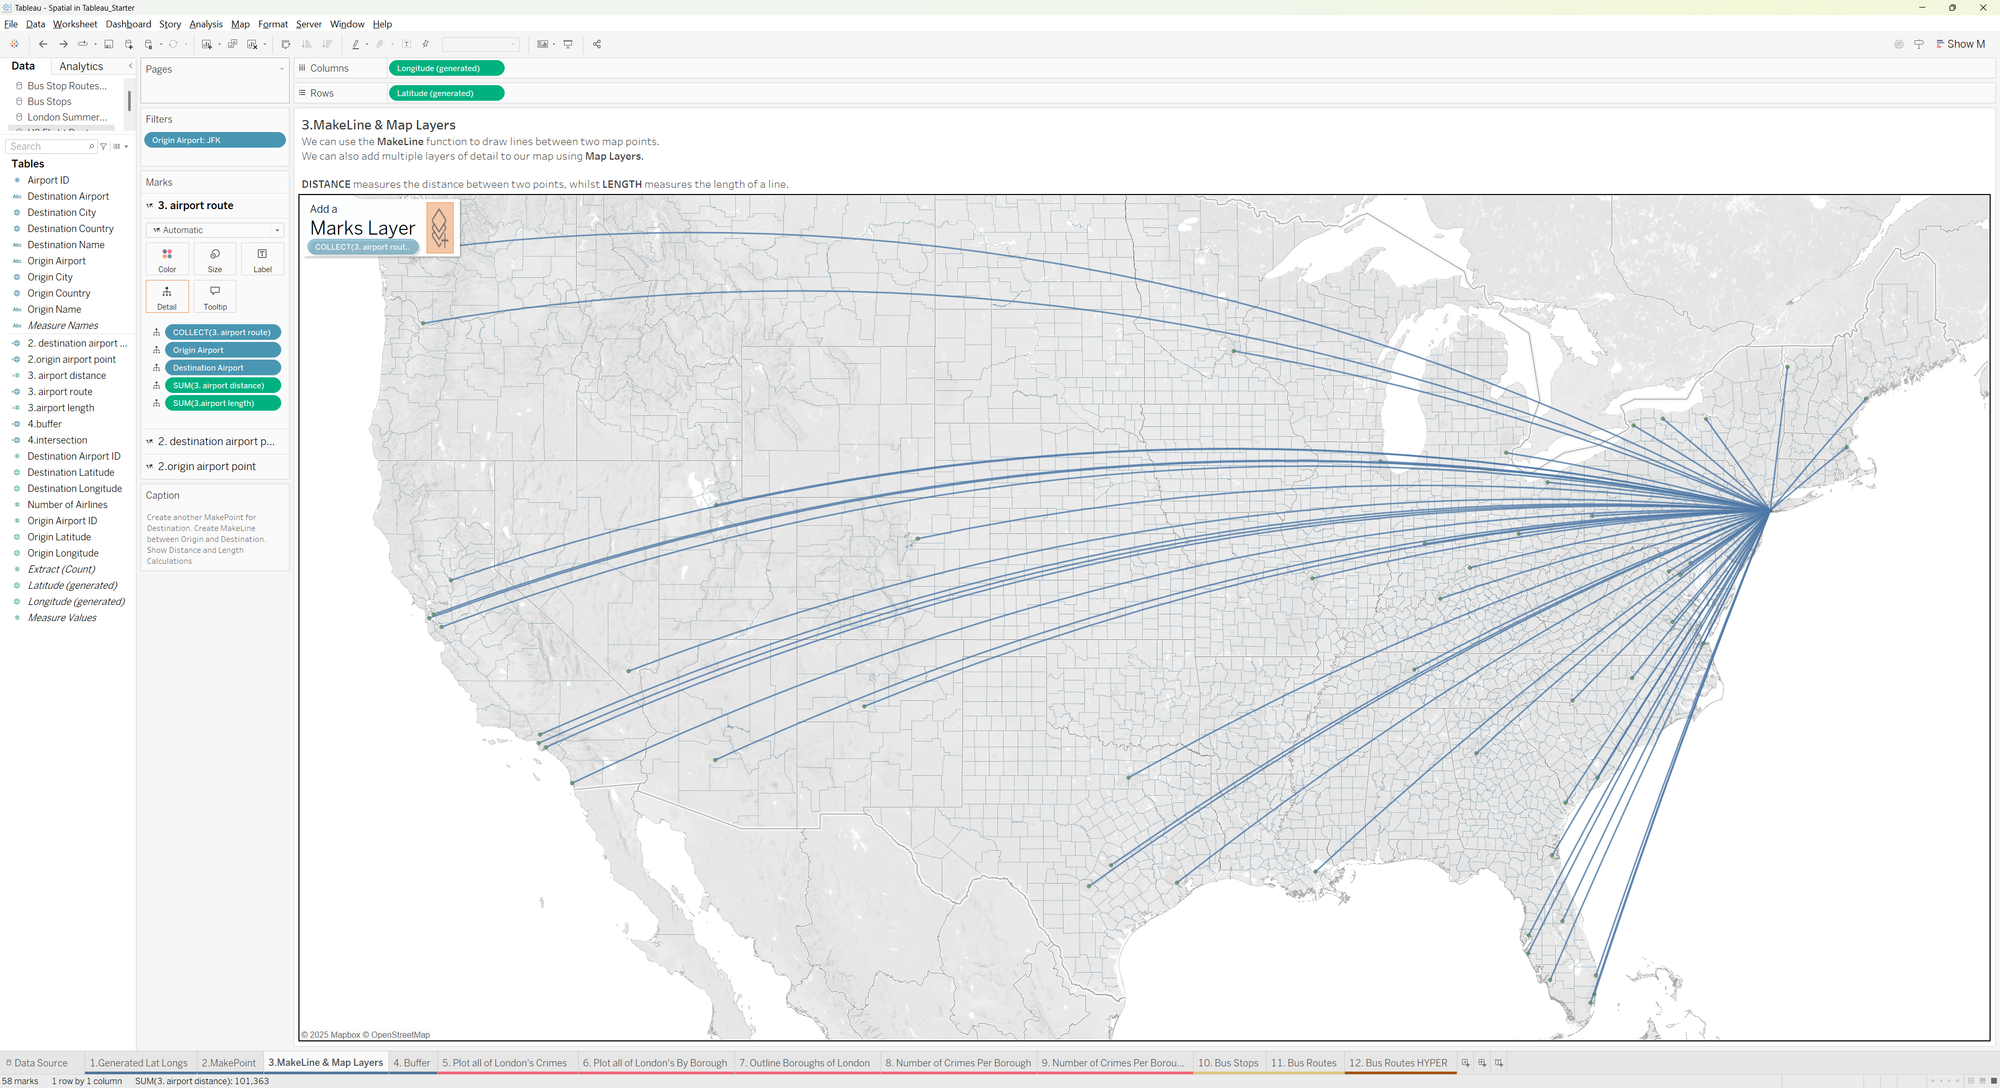
- MakeLine: connects two spatial points together using a line (curved due to curvature of the earth).
- Distance: calculates distance between two points in defined units.
- Length: length in defined units, can use line polygons, whereas distance requires two geometric points.
- Buffer: creates a buffer radius around all points and can be parameterised.
- Area: calculates area of polygon or multipolygon
- Outline: returns polygons converted into linestrings (shape of polygon)
- Intersects: boolean indication of whether two geometries intersect
Map layers allow multiple levels of detail to be added to the map by dragging the field onto the map until the new marks layer appears (as shown below).
Alteryx
Alteryx is the tool of choice for heavy-duty geospatial data preparation and complex spatial processing.
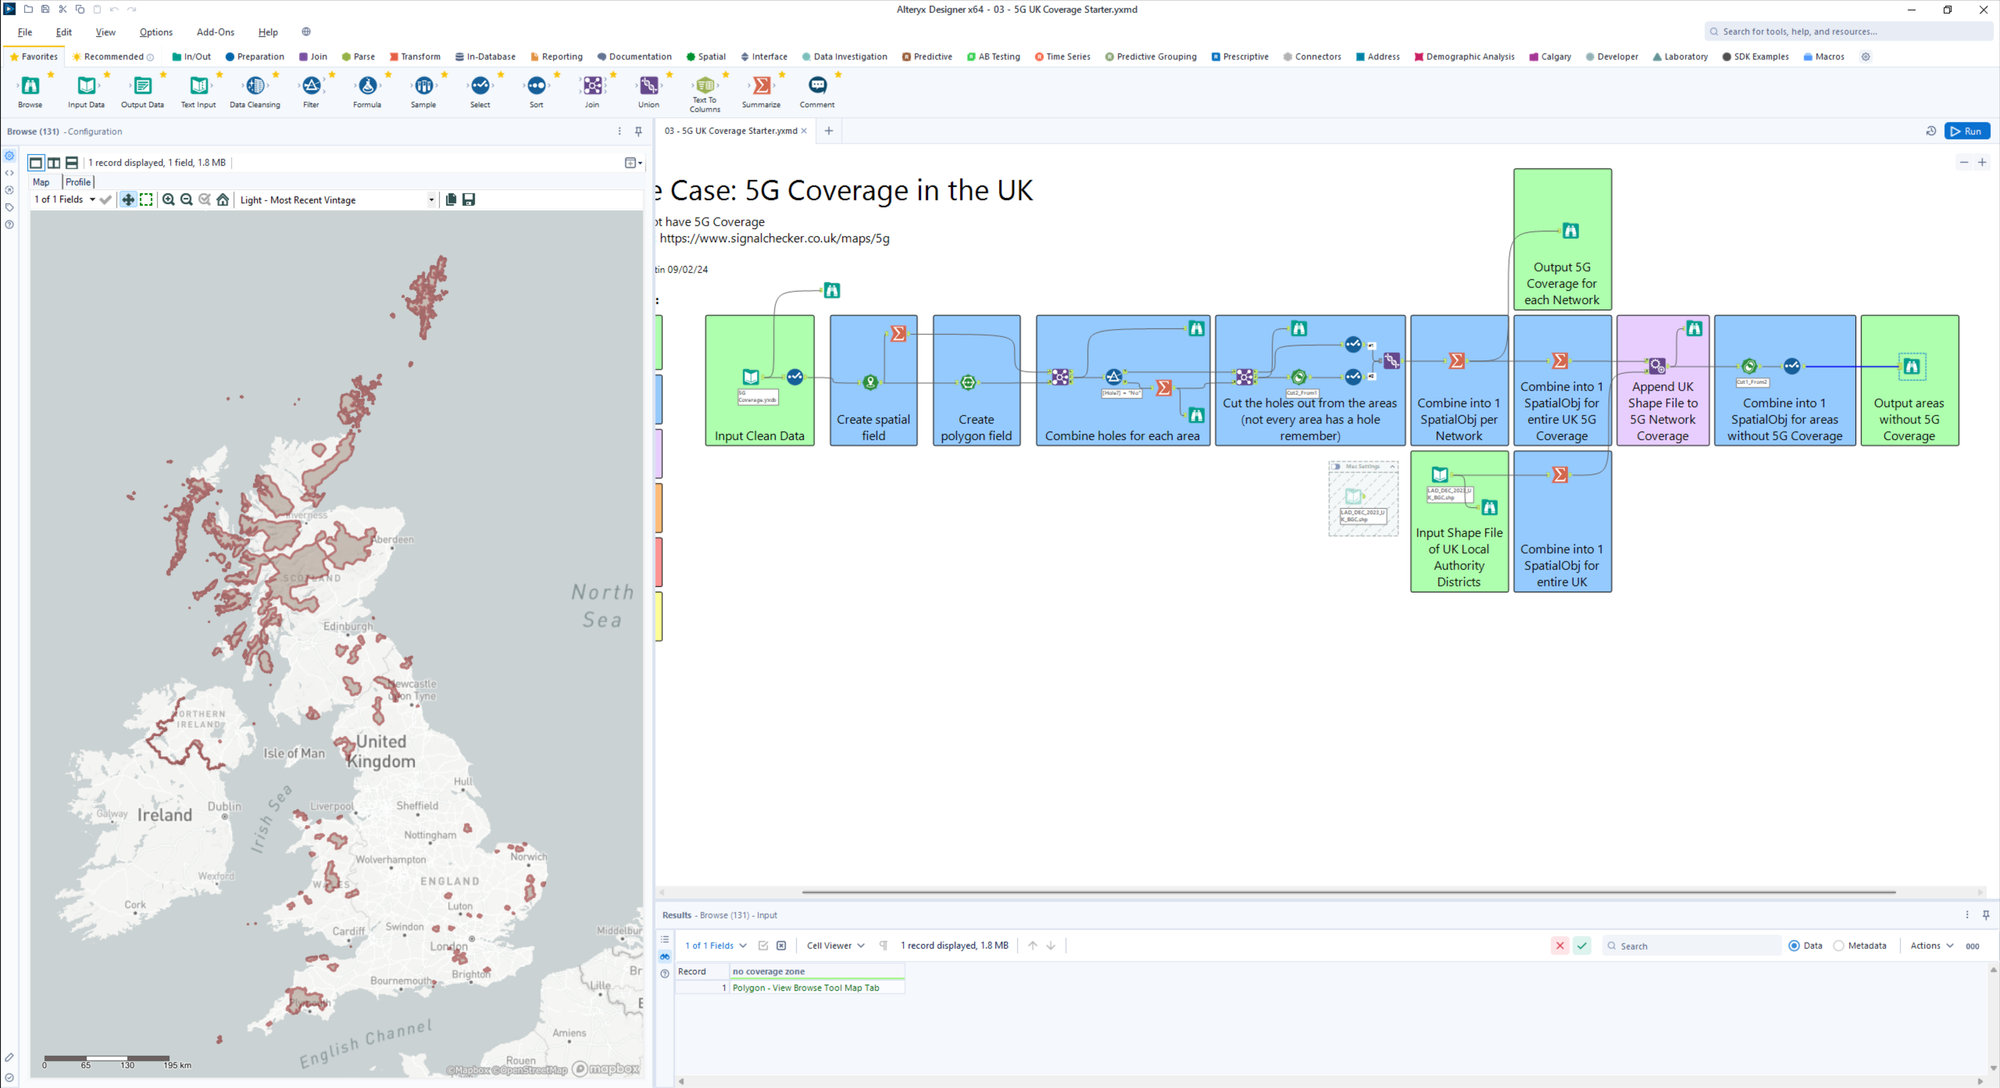
- Use Case: Alteryx is useful for simplifying large spatial datasets that might cause slow rendering times in visualisation tools (e.g., reducing the mark count for a complex boundary).
- Spatial Tools: It offers specialized tools to handle tasks like Drive Time Analysis, Spatial Match (spatial joins), and Trade Area creation. (Spatial tools see below)

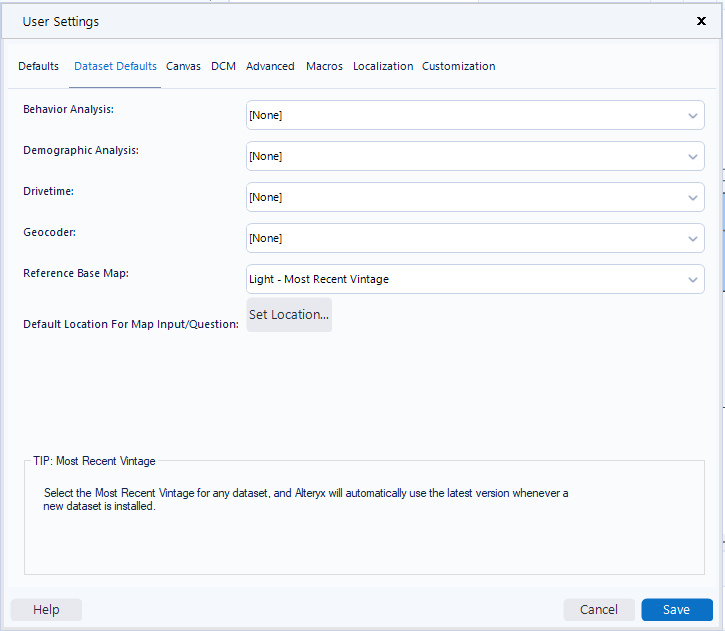
- The Browse tool allows you to quickly view and inspect spatial data on a map within the configuration pane. (Note: make sure to have a reference base map selected in user settings as below)
- Example: Investigations like identifying areas without 5G coverage can be efficiently conducted and checked using Alteryx's spatial processing tools. (see example below)