


The Data School Blog is a place for new consultants to journal their time in training, whether in the form of Tableau tutorials, experiences from the training process, or personal data projects incorporating the Data School curriculum. As a fun combination of a personal data project and a look back at the blogs and bloggers that have come before me, I set out to make some visualizations representing all of the previous blog posts from the Data School New York.
1. Data Collection
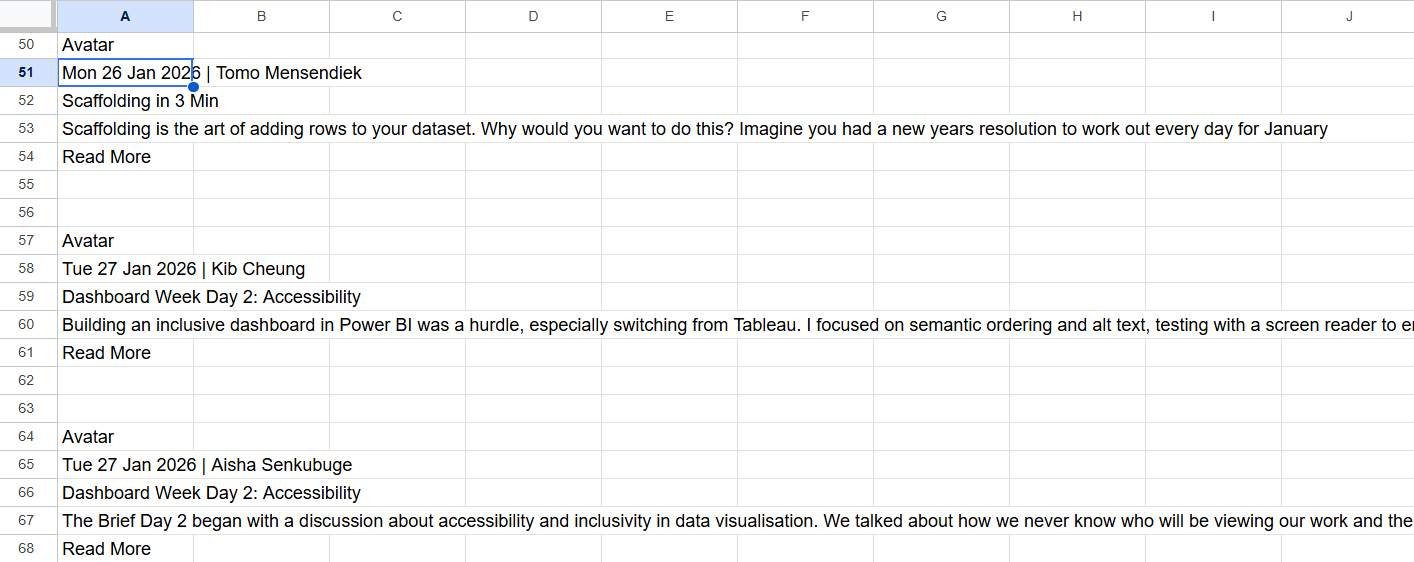
The first step of the process, before any cool data visualizing, was retrieving the data I was going to use. You can read volumes on web-scraping methods, but I went for an extremely simple, brute-force solution: copy-pasting the entire website. I went to the Data School NY website, scrolled to the bottom of the blogs, and copied all of the text on the page to clean later. Here is some of the raw data:
As rudimentary as my copy-paste system may seem, it is an example of finding a resourceful solution to a difficult problem. As a development data analyst, you won't always know the most advanced technologies or techniques. In my opinion, going out of your way to find a manual solution, even if it is tedious or roundabout, is extremely helpful for growth and helps you do interesting projects before collecting all of the technical know-how.
One of the original goals of my analysis was to see how different cohorts have compared in terms of their total blogging output, so I needed to attach the author names from above to cohort numbers! To achieve this, I did a similar scraping technique of bios from the Data School website, getting the names and cohorts of everybody from the first 11 cohorts thus far.
2. Data Cleaning and Transformation
From here, I uploaded both datasets into Tableau Prep, Tableau's data cleaning and transformation software. After a lot of cleaning, I joined the author dataset with the bios dataset using names. There were mismatches (former Data Schoolers who published blogs but do not currently have bios up), which I resolved through external research to confirm their cohorts. The final step of my data preparation was outputting it as a .csv file to upload into Tableau to visualize!
3. Insights
Compiling the data altogether like this leads to some immediate summary statistics of interest. For instance, as of the publishing of this blog, there have already been 1,103 blogs published on the Data School New York website (this will be the 1,104th).
There are some clear leaders of the pack who have been long-time, passionate bloggers. I will give them the credit and celebration they deserve by including the Top 10 most prolific bloggers (by # of blogs) here:
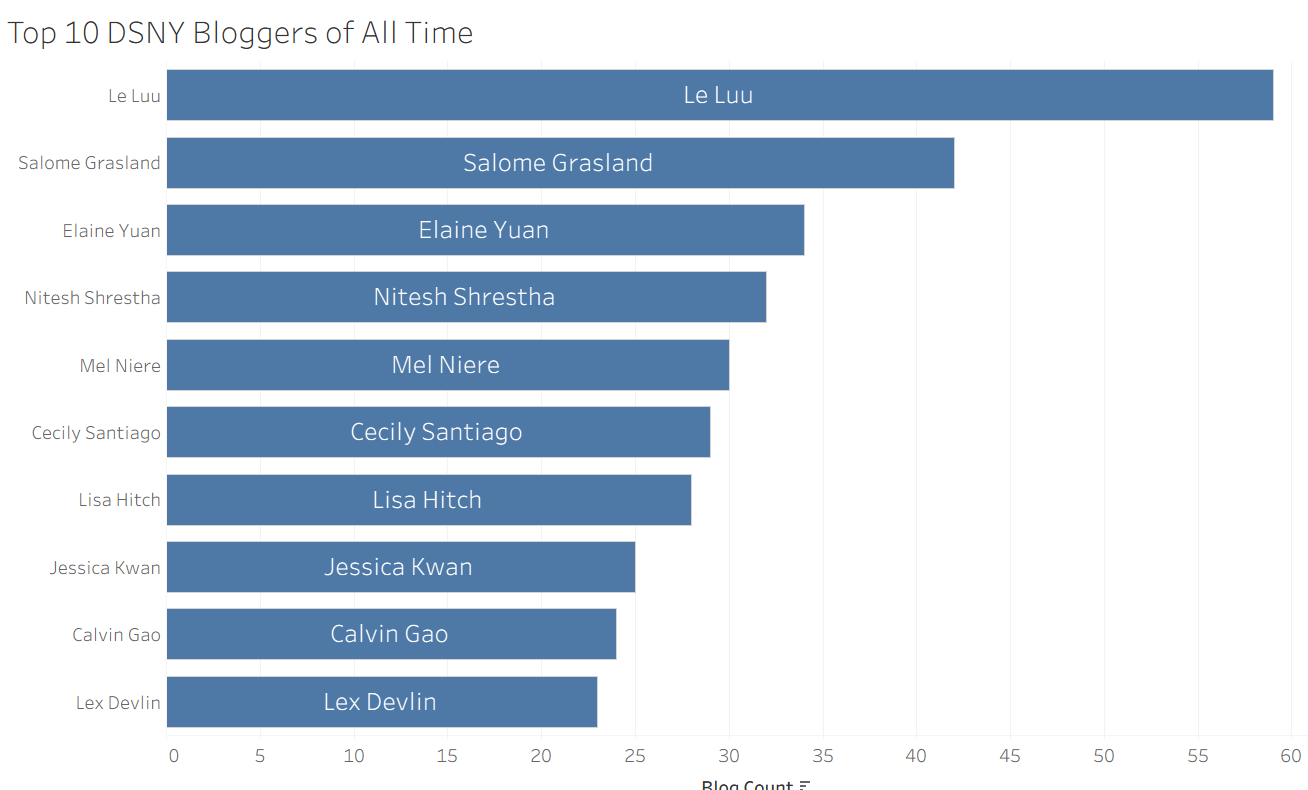
If you're curious, Le Luu has published 59 blogs! Everybody in the top 10 has published over 20.
The question I was most curious about going into this project, though, was which cohorts have been the most dedicated bloggers. Combining the cohort number data with author names, I developed this bar chart sorting the "bloggiest" cohorts, while also giving credit to the individuals within them:
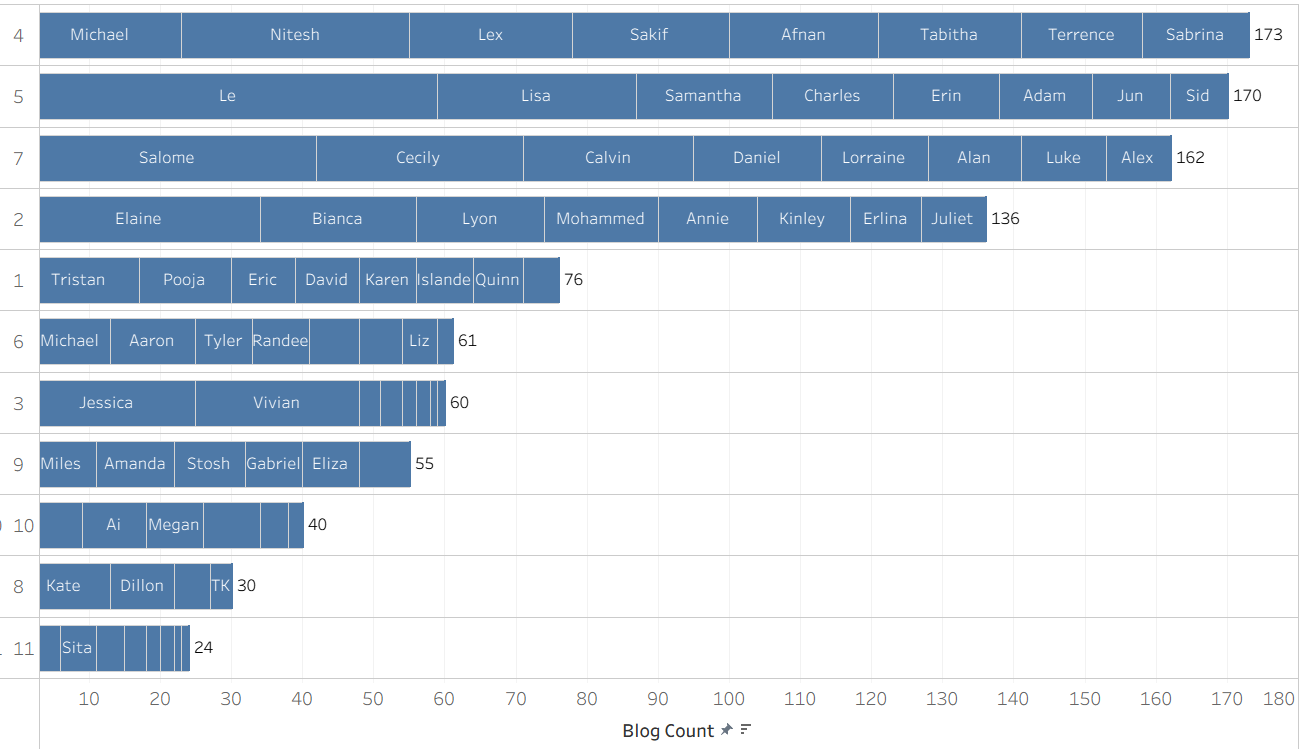
Cohort 4 leads the way with 173 blogs total, while the legendary Le Luu has brought cohort 5 extremely close. I am looking forward to seeing my fellow cohort members climb this list as we learn more in our training!