


Have you ever built a line chart in Tableau and seen broken lines, missing dates or gaps where sales were zero? This is a very common hurdle in data visualisation - Tableau can only display the data that actually exists in your rows. If nothing happened on a particular date, there may be no row for that date, so Tableau just skips it or connects the dots across the period. The solution to this problem is a technique called data scaffolding.
What is Data Scaffolding?
Data scaffolding is the process of joining your incomplete dataset to a complete 'scaffold' table - a master list containing every possible dimension value you need (most commonly dates). In Tableau, a data scaffold acts as a baseline grid. Once you attach your raw data to the scaffold, every date or category has a dedicated spot, ensuring the totals, zero-counts and continuous timelines render accurately.
The 2 Most Common Uses:
- Filling Date Gaps
If you are tracking daily sales, there may be days with zero sales, and on these days the database would record no transactions. If you plot daily sales over time, Tableau either omits those days entirely (causing inaccurate average calculations) or draws a straight line between the surrounding dates, hiding the reality of zero sales.
For this case, you would use a scaffold table containing a single column with every single calendar date for the time period you are analysing. Every date would then appear on the x-axis; dates without transactions return 'null' which can easily be cleaned up used ZN([Sales Field] to display 0.
- Start/End Dates
If you are looking at a data set where only start dates and end dates are recorded, then a scaffold can help with analysis of the data in the dates between. An example could be a magazine subscription data set where you only know when a customer signed up and when they cancelled, but you want to see how many customers you had in a certain month.
In this case, you would use a scaffold data table showing the complete dates (for example, the first day of every month for monthly analysis). Each customer's data would then show up for each of the months between their start and end date.
How to Add a Scaffold When you Have Start and End Dates:
Step 1: First, make sure that the start date field and end date field in your data set are 'Date' fields, not 'DateTime' fields.
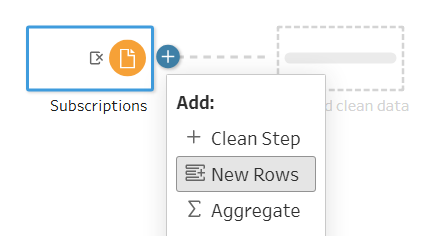
Step 2: Open your data in Tableau Prep and click on the '+' icon to select 'New Rows' as your next cleaning step.
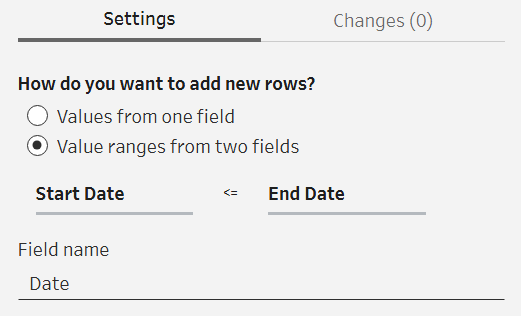
Step 3: Now you want to click 'Value ranges from two fields' and insert the Start Date and End Date fields from your data, renaming your new field as you want.
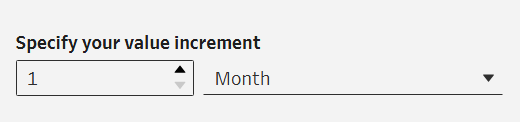
Step 4: Select the time increment you want your data in under 'Specify your value increment'. For example, if I want to do a monthly analysis, I would choose 1 Month as the value increment.
Step 5: Under 'What values should your new rows have?', you need to think carefully about whether you want to copy the data from the previous row or not. In the case of a magazine subscription dataset where we're adding month increments for monthly analysis of customers, we would want to choose 'Copy from previous row' as we want to keep the same customer data for the dates in-between their start and end dates. If we were dealing with sales data, you would not want to copy from the previous row as this would inflate our monetary values.
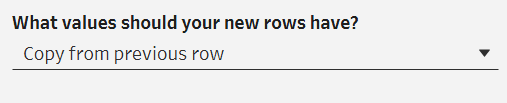
Step 6: After choosing 'Copy from previous row', Tableau will populate the cells so we are no longer left with nulls.
This means we now have a row for each month!