


See the Tableau Public Version here
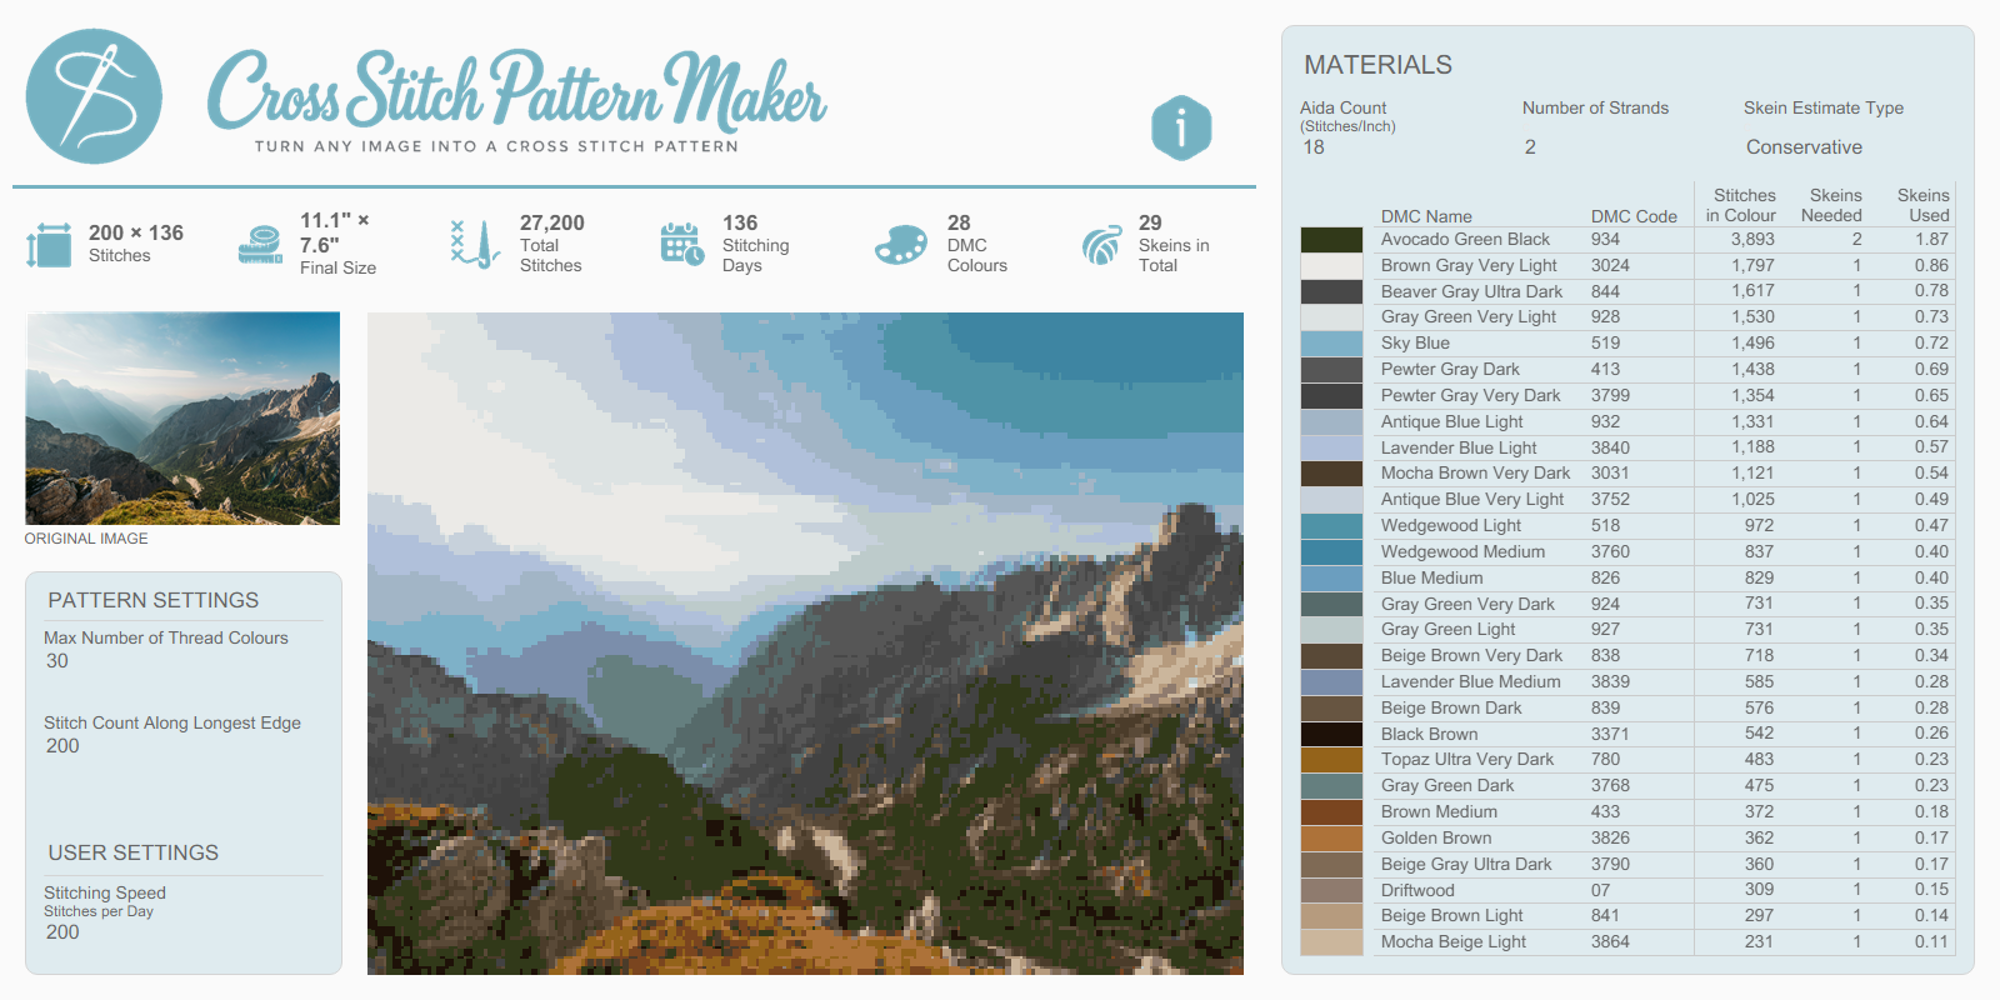
I recently found an online tool that turns an uploaded image into a cross-stitch pattern and produces a list of the embroidery threads needed to make it - and thought it seemed like the perfect challenge to recreate it in Tableau.
Based on my own experience with the tool, I also decided to add a few new features. I recently committed to making a 200 × 200-stitch pattern without fully appreciating either its final physical size or just how long 40,000 individual stitches would take. This inspired the inclusion of a “Total Stitching Days” estimate based on the number of stitches someone expects to complete each day, something I will no doubt find very useful next time.
The original tool also listed the number of pattern stitches in each thread colour but left the user to calculate how many skeins of each they would need. That calculation depends on factors such as the Aida count of the fabric and the number of thread strands used for each stitch, to convert a standard stitches per skein estimate which uses 14- count aida and assumes 2 strands. I thought it would be helpful to automate this calculation with user inputted aida count and number of strands.
As someone who prefers to buy cautiously rather than run out partway through, I also allowed users to choose a more generous skein estimate. The dashboard shows both the calculated decimal quantity and the number of full skeins required, so users can distinguish between values such as 0.97 and 0.23 even though both ordinarily round to one skein.
With these considerations in mind, my final version shows the pattern and required thread colours alongside its likely finished dimensions, dynamic material quantities and estimated completion time, helping users plan a project before committing to a design.
The final project has two versions. The full Tableau Desktop version uses Python and TabPy to process an image dynamically, while the Tableau Public version uses several preprocessed images and preset options. I’ll explain that distinction, and the reason for it, later in this post.
The finished tool
The finished tool turns an image into a customisable cross-stitch pattern using real DMC embroidery thread colours.
Users can control:
- Pattern size: The number of stitches along the image’s longest edge. The number along the other edge is calculated automatically to preserve the image’s proportions.
- Maximum colours: The maximum number of different thread colours used to recreate the image.
- Aida count: The number of squares (or stitches) per inch of cross-stitch fabric. For the same number of stitches, a higher Aida count produces a physically smaller finished piece.
- Number of strands: The number of strands of embroidery thread used for each stitch, which affects how much thread the pattern will need.
- Skein estimate: How conservatively the dashboard should estimate the number of skeins required.
- Personal stitching speed: The number of stitches the user expects to complete each day, which is used to estimate the project’s completion time.
As these settings change, the dashboard updates the pattern, finished dimensions, total stitch count, estimated number of colours, skeins required and completion time.
The materials table lists every DMC thread used in the pattern, including its name and code, stitch count and estimated number of skeins. Selecting a thread highlights every place it appears in the pattern.
How the desktop version works
The desktop version combines three layers of processing:
- A Python preprocessing script converts the selected image into a lightweight pixel dataset.
- Tableau uses the pattern-size parameter to group those pixels into a grid of stitches and calculate the average colour of each stitch.
- TabPy uses the maximum-colours parameter to simplify the colour palette and match each group of stitches to a real DMC embroidery thread.
This structure lets the user experiment with different pattern sizes and colour limits without storing a separate copy of the data for every possible combination of settings.
Preparing the image data
Before the image is brought into Tableau, a Python script resizes it so that its longest edge matches the maximum pattern size supported by the dashboard.
The script then creates one row for each pixel in the resized image, containing:
- its horizontal and vertical position
- its red, green and blue values
- the dimensions of the processed image
Using the maximum supported pattern size preserves enough detail to generate every smaller pattern available in the dashboard. It also avoids bringing the original image into Tableau at its full resolution, which would create a lot of unnecessary rows and make the workbook considerably heavier.
This preprocessing happens once for the selected image. The pattern settings can then be changed interactively within Tableau.
Creating the stitch grid in Tableau
The user chooses how many stitches should run along the image’s longest edge. Tableau uses the image’s original proportions to calculate the number required along the other edge.
Each pixel in the preprocessed image is then assigned to a position in the new stitch grid. Tableau calculates the average red, green and blue values of all the pixels assigned to each position, producing one representative RGB colour for every stitch.
Reducing and matching the colours with TabPy
Tableau sends the stitch-level RGB values and the user’s maximum-number-of-colours setting to Python through TabPy.
Python uses K-means clustering to divide stitches with similar RGB values into the selected maximum number of colour groups. In most cases, this produces the requested number of clusters, although fewer may be produced if the image does not contain enough distinct colours. Each cluster is then matched independently to its nearest DMC thread, so multiple clusters may ultimately be assigned the same thread colour. The finished pattern may therefore use fewer unique DMC threads than the selected maximum.
K-means calculates a central RGB value for each cluster. This gives the pattern a simplified colour palette, but those colours don't yet match up to real embroidery threads.
Each cluster centre is then compared with every colour in the DMC thread palette. The script calculates the squared RGB distance between them and selects the DMC colour with the smallest distance as the nearest match. Every stitch in that cluster is then assigned the corresponding DMC thread.
The complete process is:
TabPy returns the matched thread information to Tableau, which uses it to colour the pattern and populate the materials table.
Desktop versus Tableau Public
The full version depends on TabPy, which allows Tableau to run the Python calculations whenever the user changes the pattern settings. However, Tableau Public does not support TabPy connections.
In order to publish the pattern maker, I created a separate Public version that recreates the main experience using results generated in advance.
| Tableau Desktop version | Tableau Public version |
|---|---|
| Uses an image-specific pixel dataset | Uses three preselected images |
| Creates different stitch grids dynamically | Offers several preset pattern sizes |
| Runs K-means clustering and DMC matching through TabPy | Uses colour results calculated in advance |
| Supports a flexible maximum-colours parameter | Offers several preset colour limits |
| Calculates only the result currently requested | Stores the results for every available combination |
| Requires Tableau Desktop, TabPy and Python | Can be explored directly online |
For the Public version, I ran the complete process in advance for every available combination of image, pattern size and maximum number of colours. Tableau parameters then select the appropriate precomputed result.
This works well for three images and a controlled number of settings, but the dataset would grow rapidly if I added more images or parameter values. That is the main advantage of the TabPy version: it calculates only the result the user requests, rather than requiring every possible result to be stored in the workbook.
Problems encountered along the way
Getting from a processed image to a stable and usable Tableau tool involved several less obvious problems.
Displaying the correct DMC colours
The Python calculation could identify the nearest DMC thread for each cluster, but Tableau also needed to display that thread using the correct colour.
One issue is that Tableau cannot take colour codes directly from your data, so a custom colour palette containing all possible DMC thread colours was needed. The second problem is that Tableau colour assignments are normally tied to the values present in a view. As the image settings change, different subsets of DMC colours appear, making it difficult to maintain a consistent palette.
My eventual solution used a scaffold containing the full DMC palette. This allowed every colour to retain its intended assignment, even when it was not present in the current pattern. I have written about this separately because it became an interesting Tableau problem in its own right.
Keeping the pattern stable
My original approach created one mark for every stitch in the selected pattern. However, changing the number of stitches also changed the number of marks in the view. With a fixed mark size, patterns with fewer stitches developed gaps, while patterns with more stitches had overlapping marks.
The more reliable solution was to retain one mark for every pixel in the maximum-size image at all times. Multiple pixels can represent the same stitch, so every pixel belonging to that stitch is assigned the same final DMC colour.
The displayed grid therefore always contains the same underlying number of marks, while the apparent stitch size changes according to how the pixels have been grouped. This keeps the overall pattern dimensions stable when the user changes the number of stitches.
Calculating materials from row-level TabPy results
TabPy calculations are table calculations in Tableau. A script receives a collection of rows and must return one result for every row passed to it.
This works naturally when assigning a DMC thread to each stitch or display pixel, but it is less straightforward when the dashboard needs an aggregated result. The materials table, for example, needs one row per thread showing the total number of stitches assigned to it. While there is one row per thread in the materials table, the calculation must be done over all the pixels present in the pattern.
My solution was to count the assigned threads within the Python calculation, return each thread’s total on the first relevant row and return zero for its remaining rows. I could then filter the materials table to keep only the non-zero results before using further calculations to produce the skein estimates and overall colour totals.
This method of returning aggregated results from a TabPy calculation may be useful in other contexts too.
Rebuilding the project for Tableau Public
The lack of TabPy support in Tableau Public meant that creating a publishable version required a completely different data structure.
The desktop version calculates one requested result dynamically. The Public version instead stores every permitted result and uses parameters to move between them.
Shifting all the Python processing into the preprocessing stage produces a less flexible view and a larger dataset, so the dynamic desktop version still has clear advantages. However, this approach provides a practical way to publish the project online and demonstrate most of the original tool’s functionality without requiring users to have Tableau Desktop, Python or TabPy installed.
What I learned
This project began as a slightly odd question—can I make Tableau do that?—and turned into a much broader exercise in connecting Python and Tableau, managing different levels of detail and designing around the limits of Tableau Public.
More than anything, it reinforced that getting something to work is only half the job. Adding clear controls, explanations, material estimates and a usable interface was what turned the underlying calculations into a finished tool.
I’ll explore some of the individual technical challenges in more detail in future posts. For now, I hope this gives a useful overview of how the whole project fits together.