


One of the easiest ways to add interactivity to a Power BI report is with bookmarks.
Bookmarks allow you to capture the current state of a report page and return to it later. Combined with buttons, they can be used to create navigation menus, show and hide content, swap between visualisations, and build more engaging user experiences without requiring complicated DAX calculations.
In this post, I'll look at what bookmarks are, how to create them, and a few practical ways they can be used.
What is a Bookmark?
A bookmark saves the current state of a report page, including things like which visuals are visible and any current filter selections. When a user activates a bookmark, Power BI restores the saved state.
You can think of it as being a bit like creating a save point in a video game. The bookmark remembers the state of your report at that moment, and activating it returns the user to that saved state.
Creating Your First Bookmark
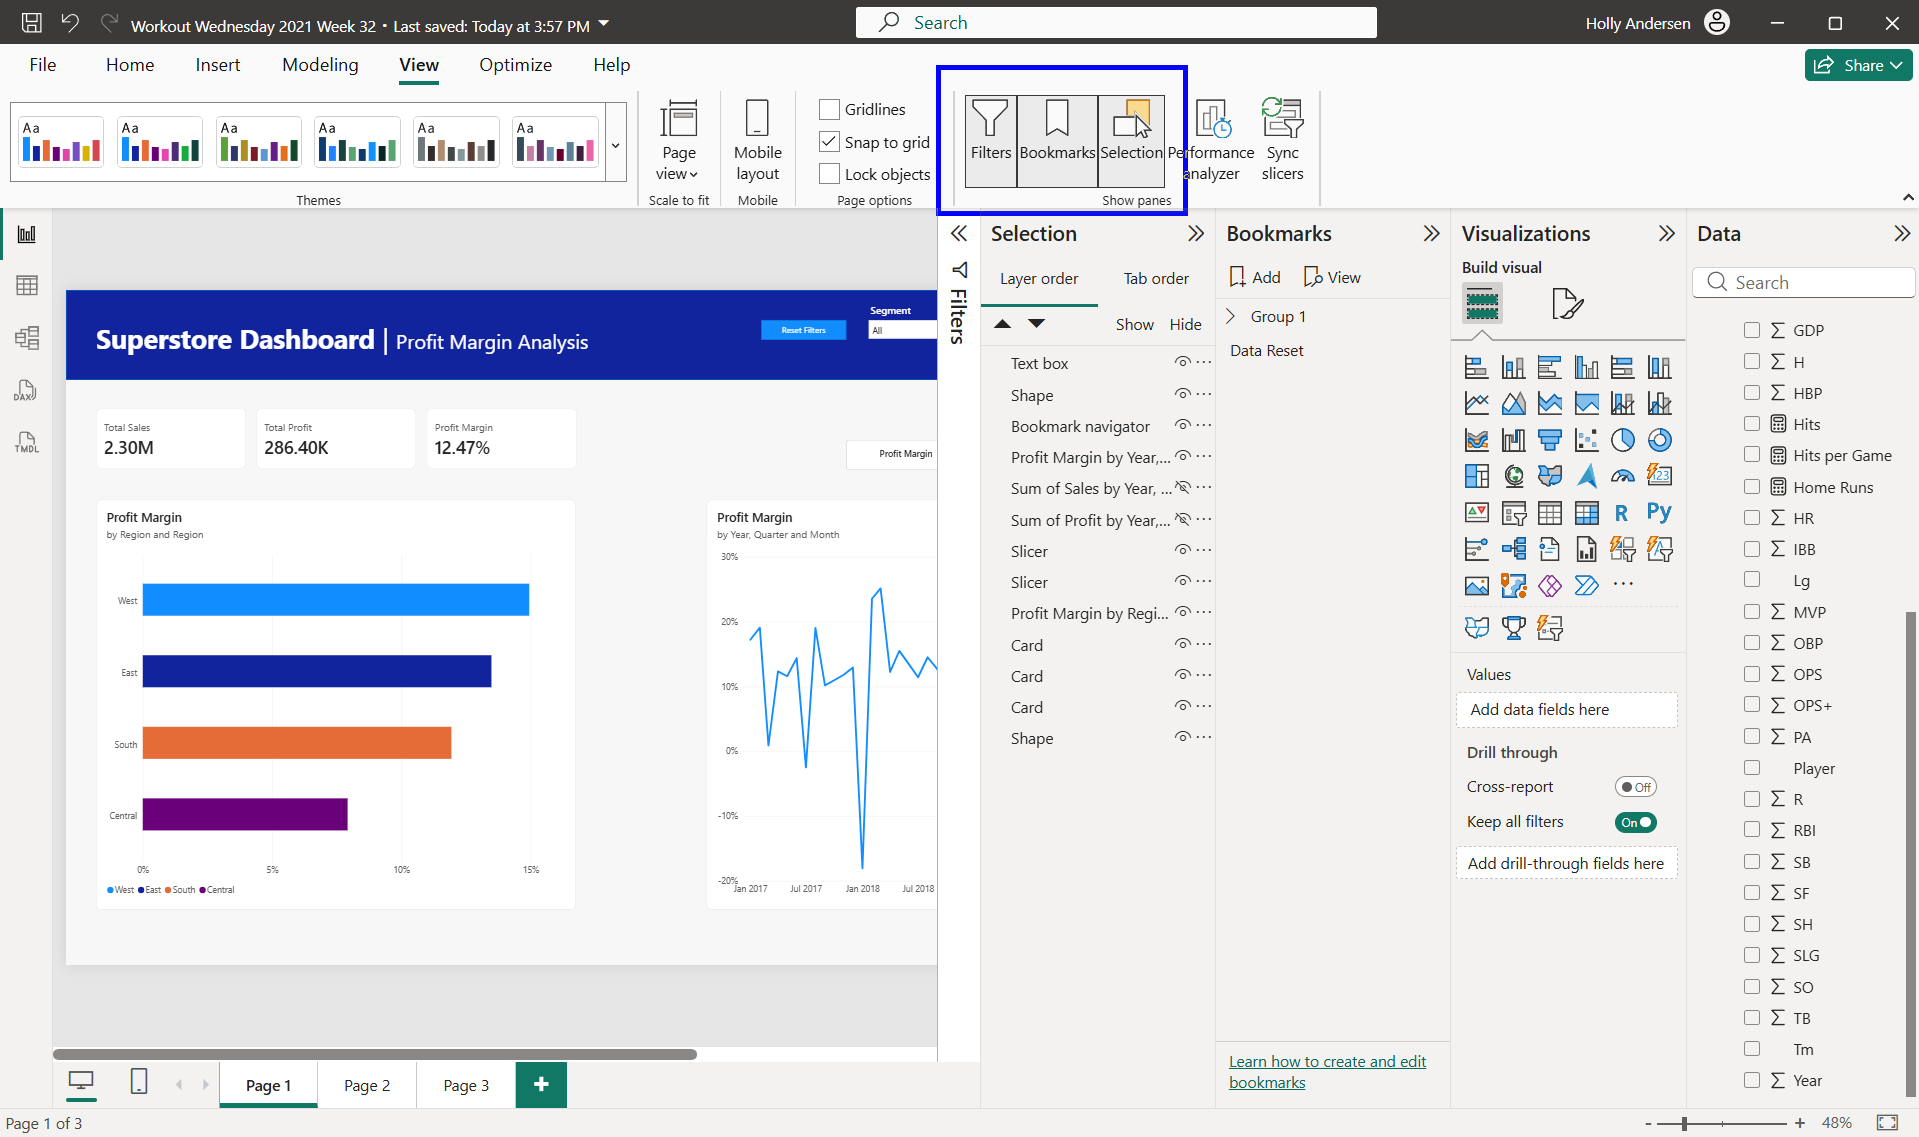
Bookmarks can be found from the View ribbon.
To create a bookmark:
- Set up your report exactly as you want it to appear.
- Open the Bookmarks Pane.
- Click Add.
- Give the bookmark a meaningful name.
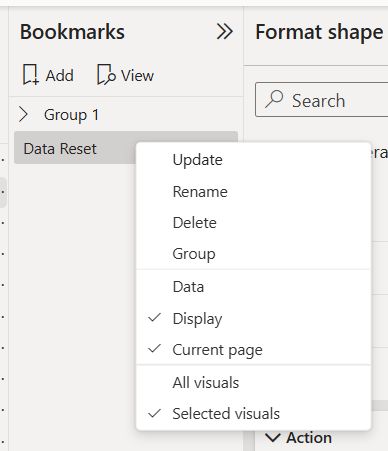
- If you make changes later, right-click the bookmark and choose Update.
Making Bookmarks Interactive with Buttons
Bookmarks become much more useful when combined with buttons.
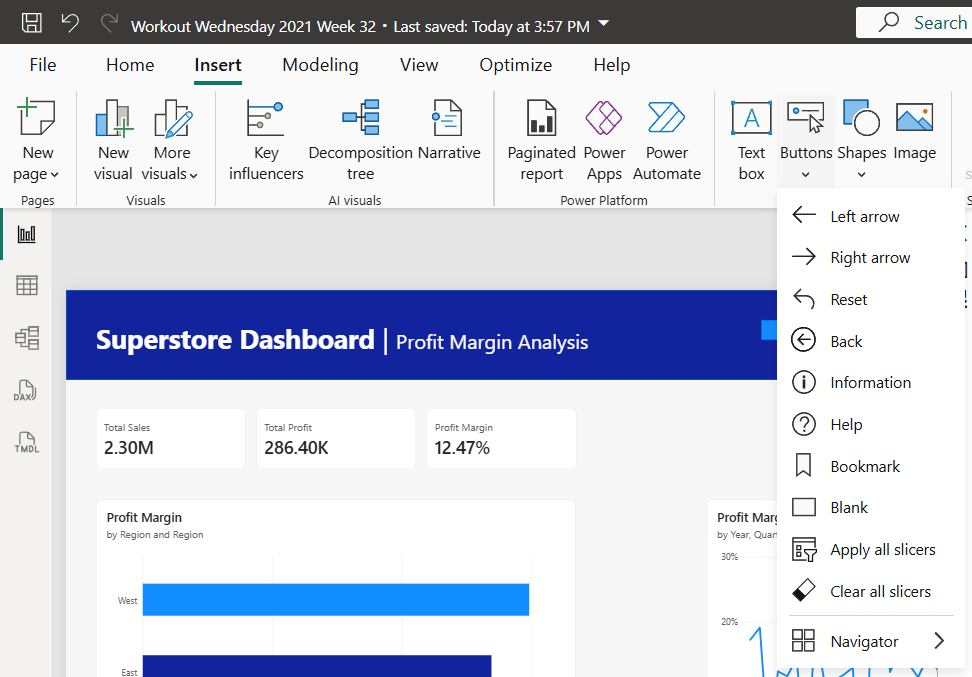
Buttons can be inserted from:
Insert → Buttons
Once a button has been added:
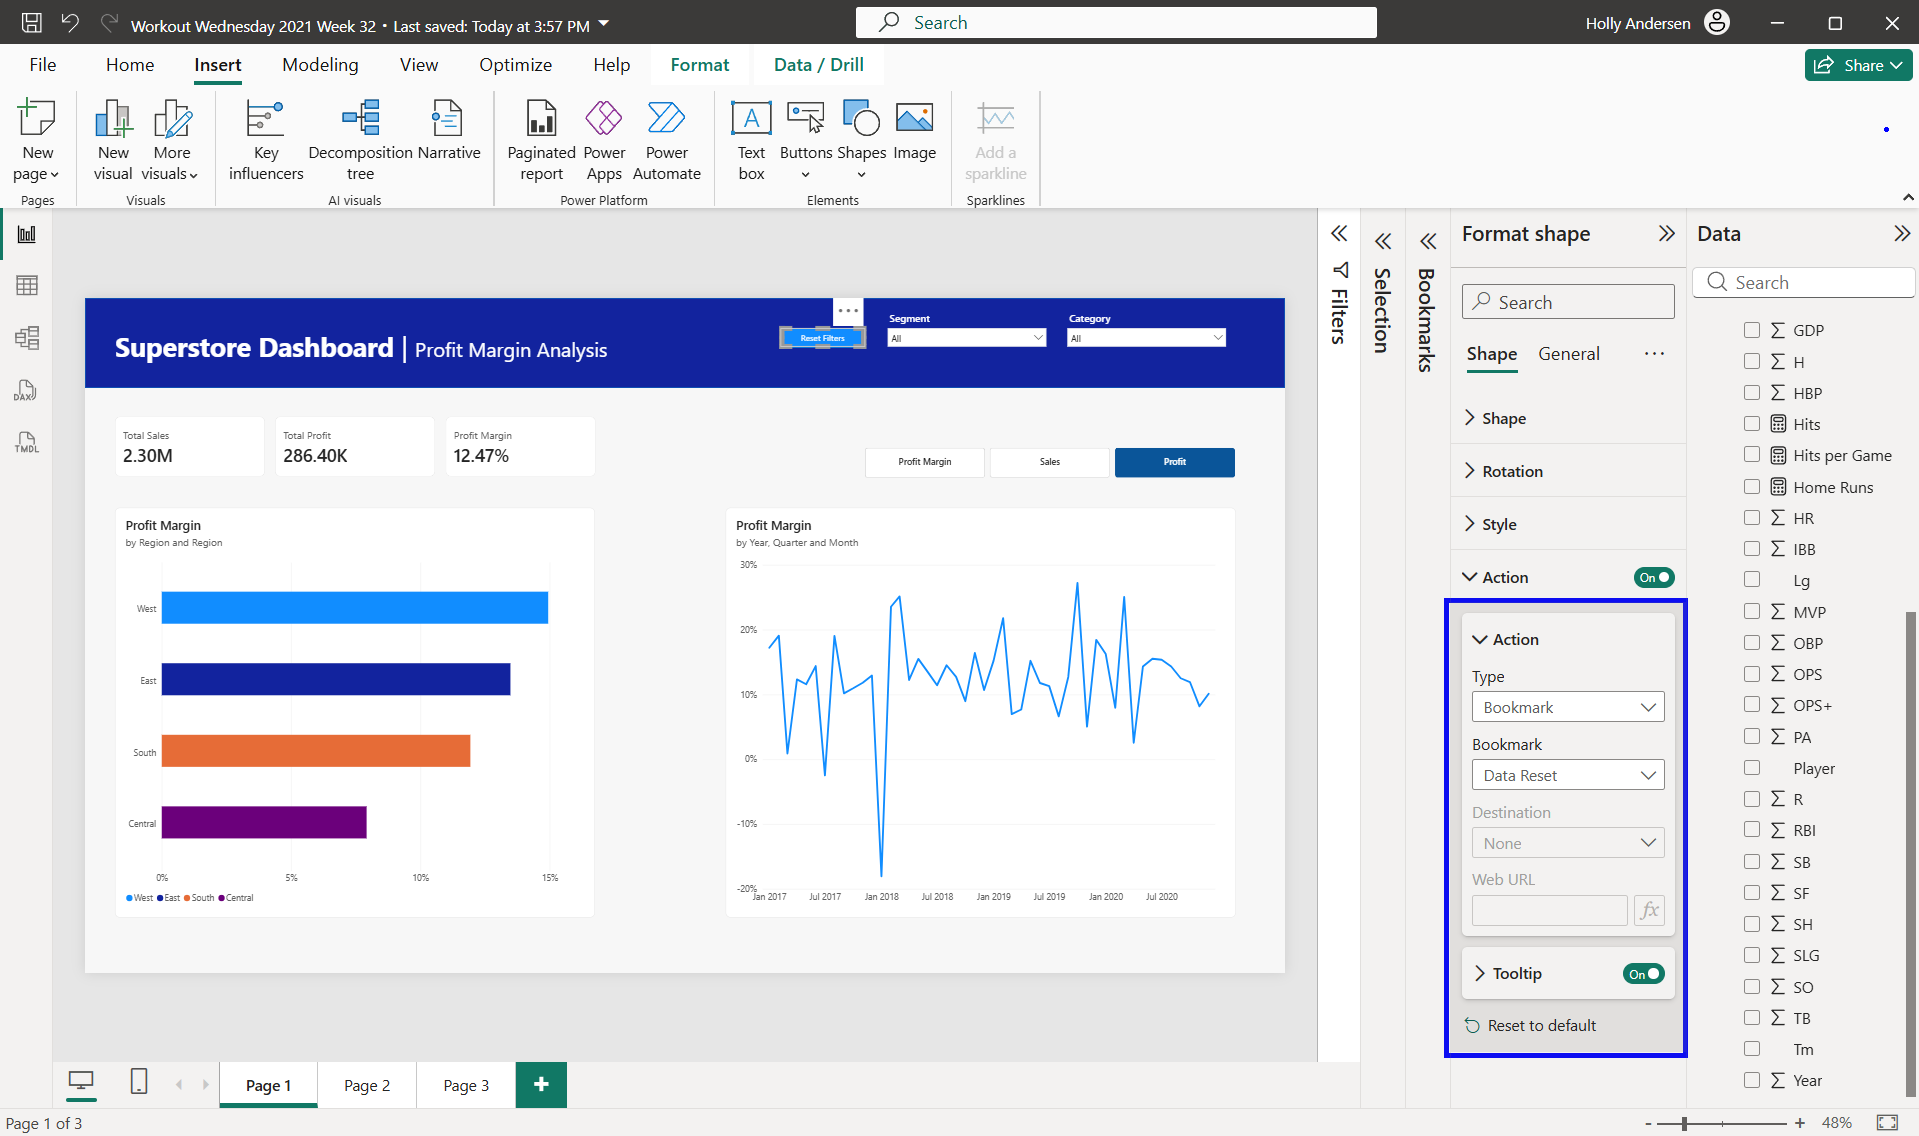
- Select the button.
- Turn Action on.
- Set the action type to Bookmark.
- Choose the bookmark you want the button to activate.
Now users can click the button to move between different report states.
Other Useful Button Types
While bookmark buttons are the most commonly used when creating interactive report experiences, Power BI includes several other button types that are worth knowing about.
Back
Back buttons return users to their previous location. They're particularly useful when using drill-through pages, allowing users to quickly return to the main report.
Page Navigation (Left and Right Arrows)
Page navigation buttons allow users to move between report pages without relying on the standard page tabs. This can create a cleaner, more application-like experience.
Navigator
Navigators automatically generate a set of navigation buttons based on your report pages or bookmarks. These can save time when building larger reports with lots of navigation options.
Clear All Slicers
If your report contains multiple slicers, a Clear All Slicers button can quickly reset user selections. Depending on your requirements, this may be a simpler alternative to creating a dedicated reset bookmark.
Although these buttons can be useful on their own, they're often combined with bookmarks to create more polished and intuitive user experiences.
Common Uses for Bookmarks
Page Navigation
Bookmarks can be used as a custom navigation menu. Rather than relying on the default page tabs, users can click buttons to move between different sections of a report. This is particularly useful when building dashboard-style reports.
Show and Hide Panels
One of the most common bookmark techniques is creating a collapsible filter pane. A button can display a panel containing filters, while another button hides it again. This keeps the report clean while still allowing users to access additional controls when needed.
To do this, group the visuals you want to show/hide in the selection pane. Then you can use the eye icon to show/hide the whole group at once in a bookmark.
Switching Between Visuals
Sometimes multiple charts answer the same question in different ways. Rather than displaying all of them at once, bookmarks can allow users to switch between views. For example, a bar chart and a map or a series of line charts with different axes - in Power BI it is possible to have these charts sitting in the same space, and to use bookmarks to switch between which chart is visible.
To do this, make sure that the visuals you want to select are all selected in the selection pane, in the correct show/hide configuration, and create a bookmark with the options for Selected visuals checked, and Data unchecked. When you use this to make an interactive button, it will only affect the selected charts, and will not affect any slicers or filters active in the view.
Reset Filters
Bookmarks can also be used to restore a report to its default state. By creating a bookmark with the desired starting filters selected, users can quickly return to a known state with a single click. This can be especially helpful when reports contain multiple slicers or complex filtering options.
A Practical Example
The dashboard below was created as part of a Workout Wednesday challenge focused on report interactivity.
How to Use This Dashboard
Try selecting different values in the slicers and then using the navigation buttons to move between views. Notice that your selections remain in place as the charts change.
This allows users to explore the data from multiple perspectives without needing to navigate to a different report page.
Techniques Used
This dashboard demonstrates one of the most useful bookmark patterns: switching between visualisations while keeping the rest of the report unchanged.
To achieve this:
- Bookmarks were created for each chart view
- Buttons were used to trigger those bookmarks
- The bookmarks were configured to affect only selected visuals
- Slicer selections were preserved between views
This approach helps reduce clutter by displaying only the visualisations the user wants to see, while maintaining the context of their analysis.
It's a great example of how bookmarks and buttons can work together to make a report feel more interactive without requiring complex calculations or additional report pages.
Final Thoughts
Bookmarks are one of the most useful interactive features available in Power BI, and also one of the most versatile.
Whether you're building navigation menus, toggle buttons, collapsible filter panels or reset buttons, bookmarks provide a flexible way to control what your users see without needing complex calculations.