For days 2 and 3 of dashboard week we were tasked with taking part in Tableau's Data + Movies challenge. This was a task to use their IMDb data to create a dashboard of your choosing, with the help of their starter kit.
My process when creating this dashboard was:
Ideas >> Plan >> Data Prep >> Dashboard
(1) Ideas
For this section, I just wrote a list of things that interested me that would be possible to explore with the data given. The list included
- Decline of the Western genre
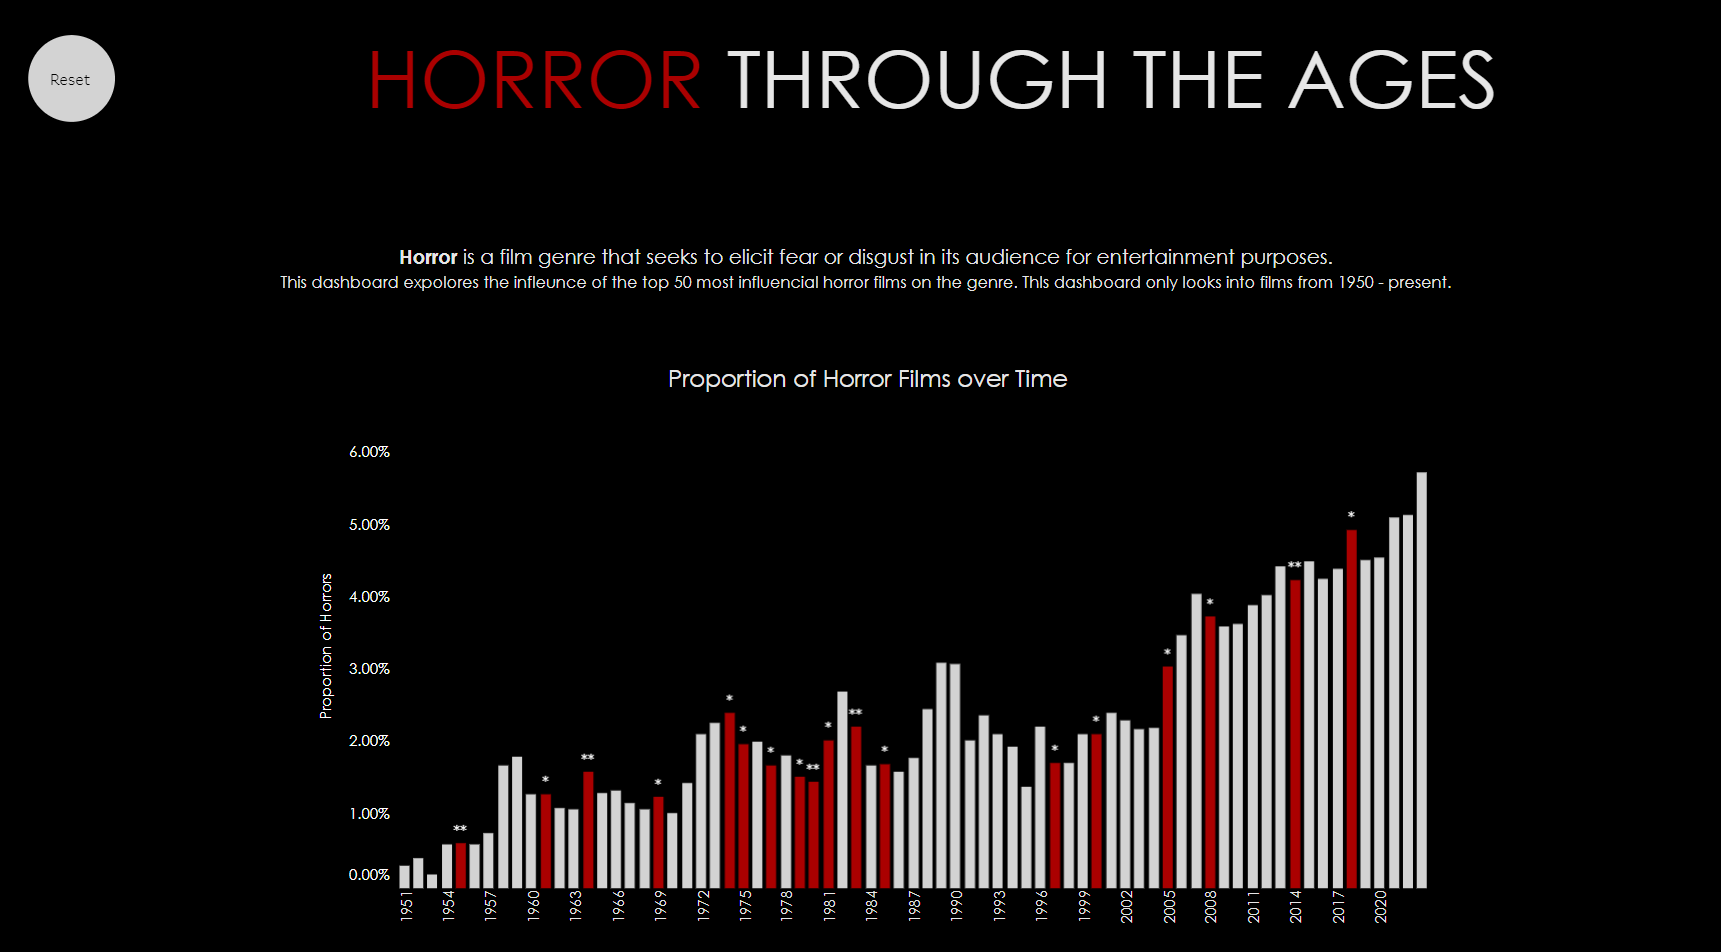
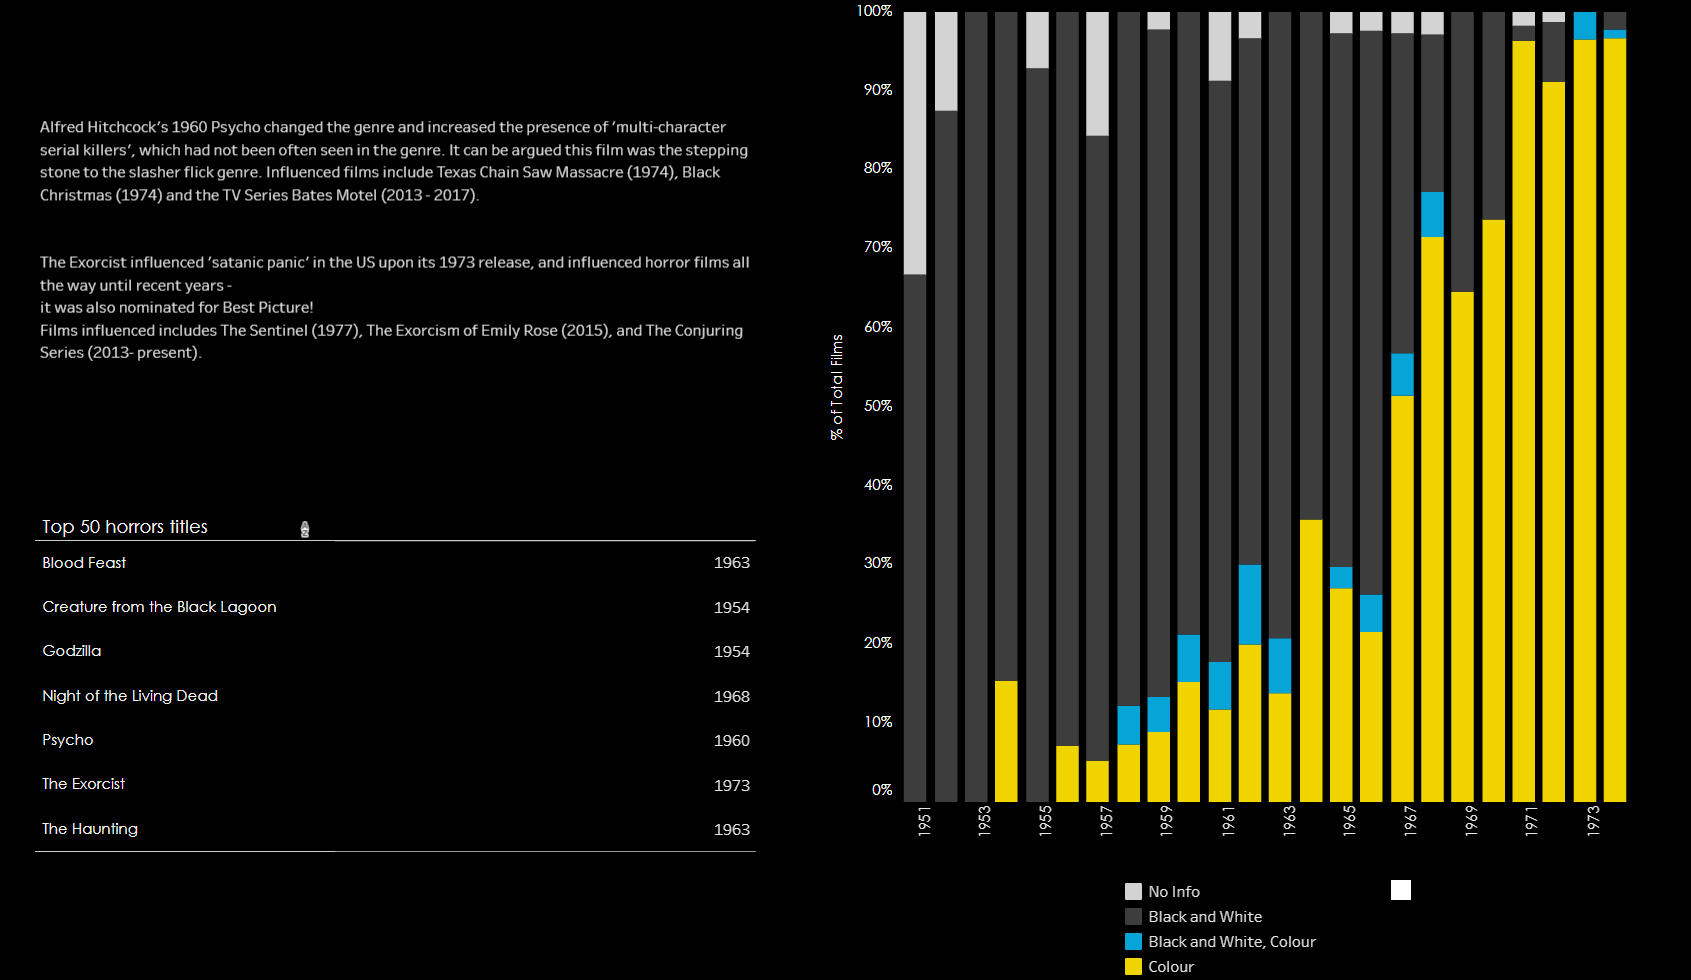
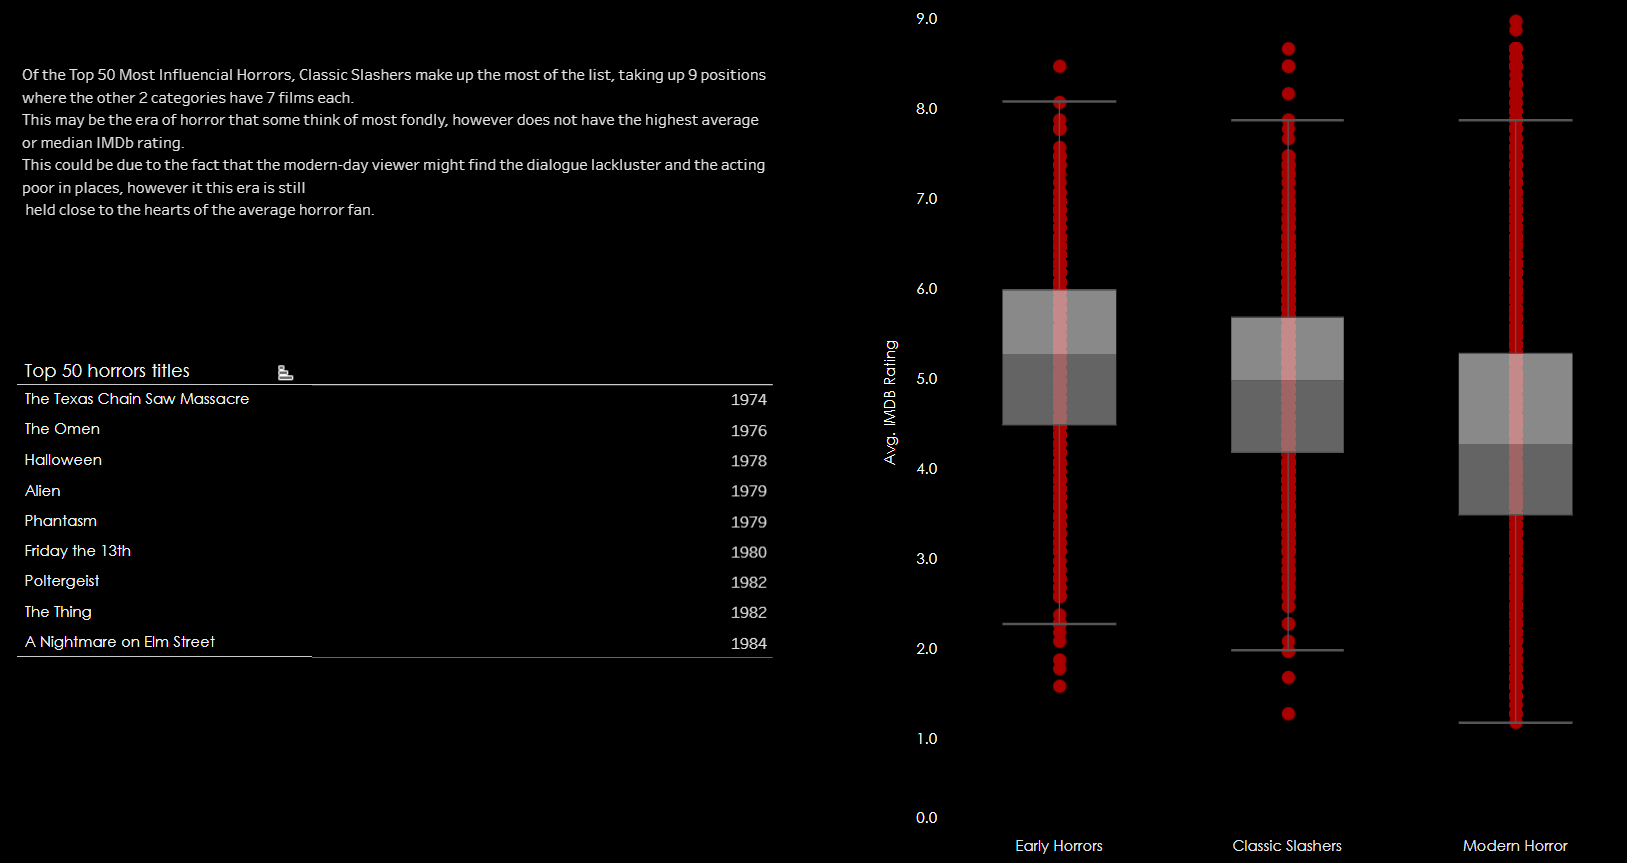
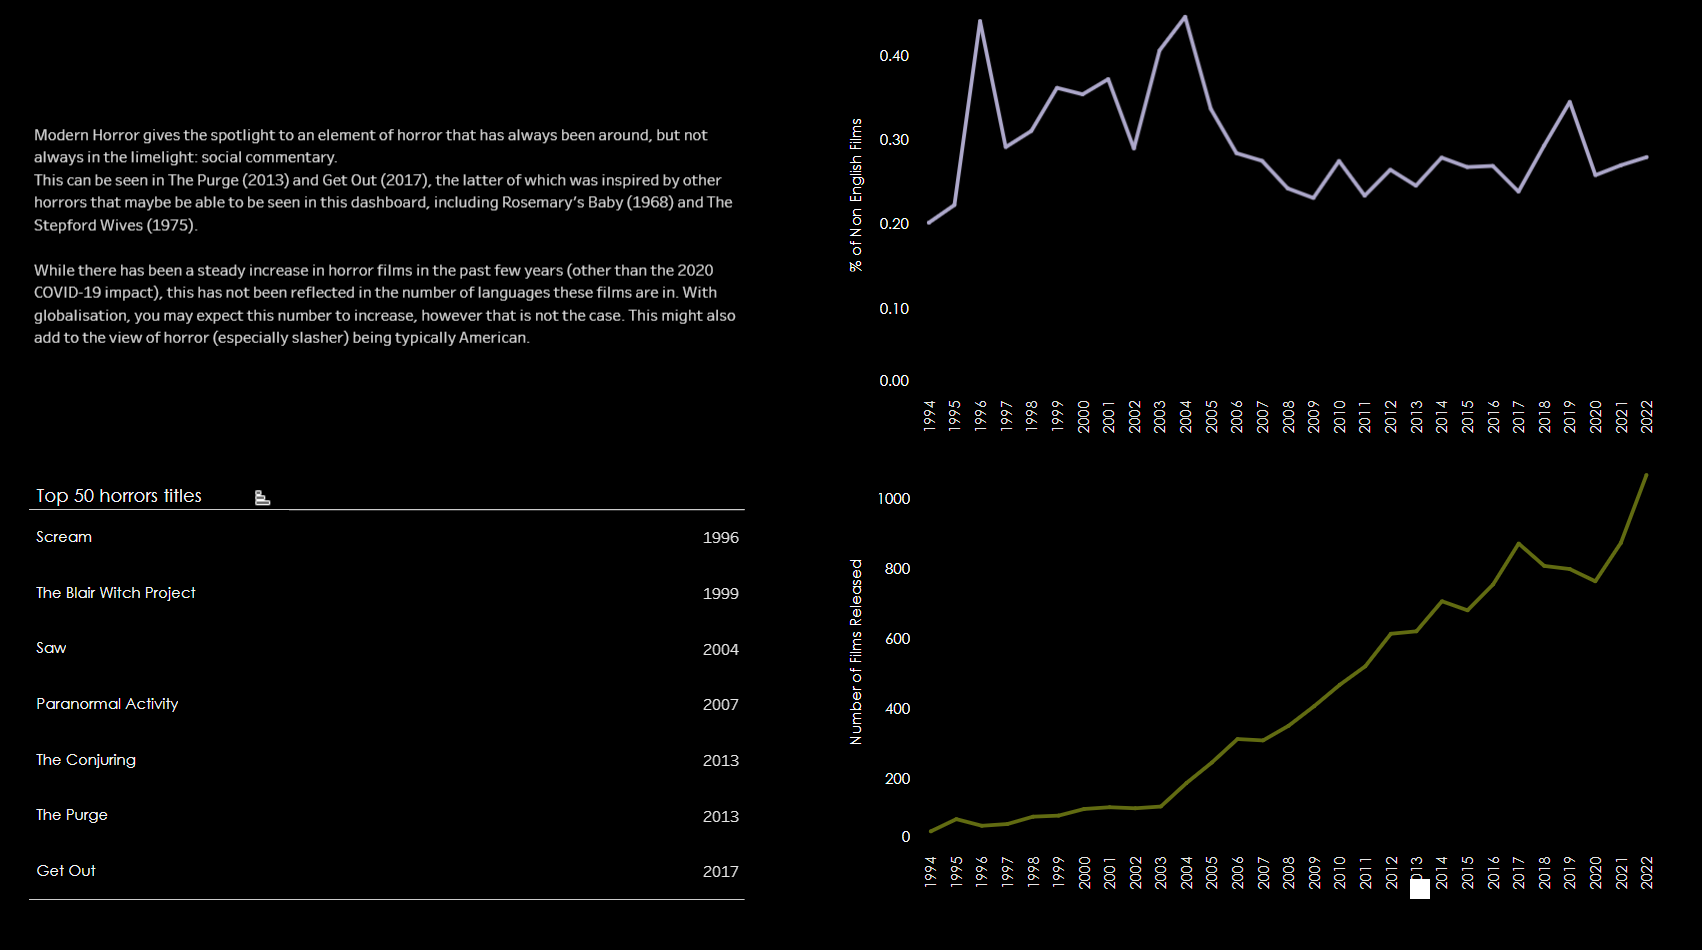
- Horrors
- Specific film series
- Common Hollywood acting/ directing pairs
- Social commentary on Hollywood stars?
(2) Plan
From this, I chose to go down the horror route as that was the most interesting to me and I could do a decent amount of investigation in 2 days.
The next step was getting onto Excalidraw to sketch out a visual:

(3) Data Prep
This consisted of 3 Alteryx Flows to filter the data to only the horror genre, and to get external data which had the top 50 most influential horrors.


(4) Dashboard
Here's the link to the final dashboard:
Open at your own risk!