


Today marks the first day of DS43's dashboard week!
We were given a dataset comprising of Lego inventory information which was a fun dataset to start with, however I found that adding supplementary data was key to creating this dashboard.
The supplementary data meant I could add context to the work, and provide interesting insights from the data given. Previously I didn't feel the need to add more data, but this exercise has really showed me how useful it can be.
In this example, I used data on Lego's revenue from 2003 - 2023 to see if there were similar trends in revenue as in the Lego inventory data we were given.
Its to note its not as straight forward as plugging in another dataset as I had to create a schema with a date table to compare values over time, and I had to do some additional data prep and convert revenue from Danish kroner to pounds too.
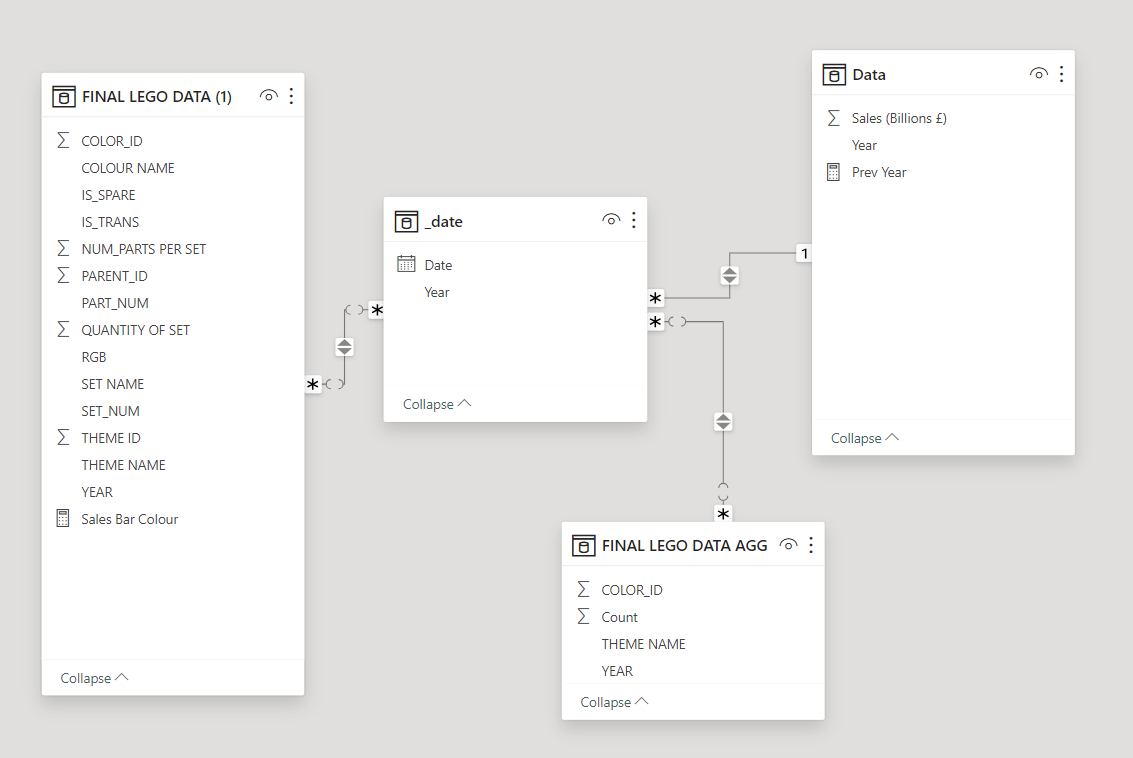
However, 1 thing we missed as a cohort was that we could have spent some time searching online for the schema for the data set given - we took it as part of the challenge, but we could have saved some time here!
Here is the final dashboard: