This was the official task for the first day:
"For day 1, the team will be analysis data about UK Street Crimes.
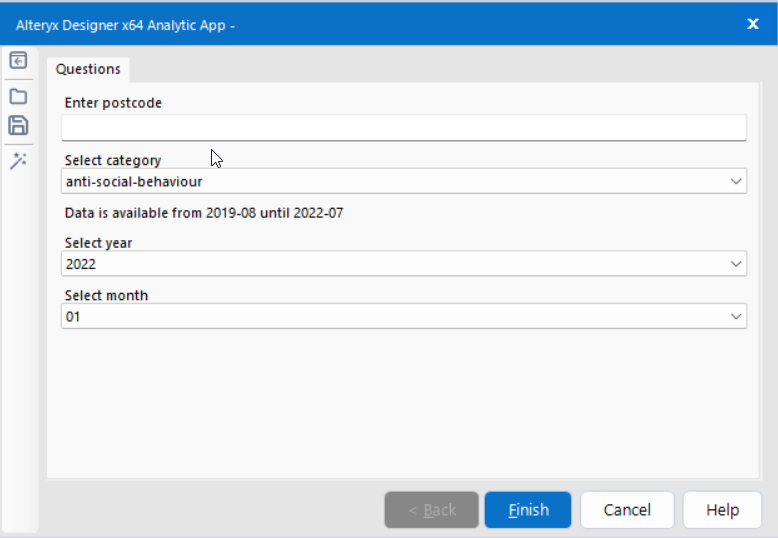
They MUST use the API. Build an Alteryx App that allows the user to pick a date range and category and enter a postcode. The app must then render a Tableau KPI dashboard automatically."
When we received the link it took us one hour to extract data from the API, because the example link (https://data.police.uk/docs/method/crime-street/) was outdated and we manually had to replace the year in the URL.
- Task: Date Range
Unfortunately I didn't manage to let the user set a range of date but only one specific month.
The user selects in the app a certain month and year and these numbers are then implemented in the API-URL. In the workflow it looks like this:
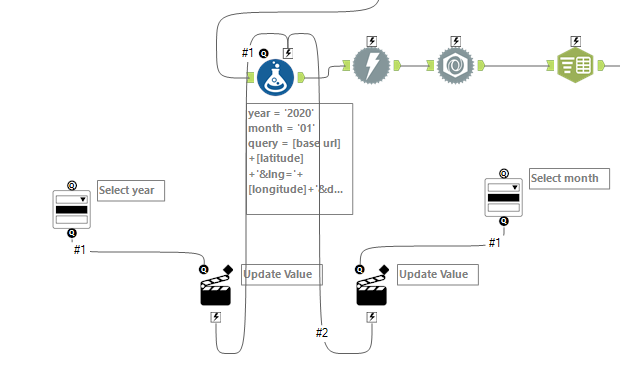
For this first step I basically followed PGB's blog about this topic: https://www.thedataschool.co.uk/peter-gamble-beresford/using-api-alteryx-retrieve-data
The API only gives data from the 08/2019 to 07/2022. The only solution I found for this problem was to write a note in the app about which selection should not be made.
2. Task: Enter Postcode
I imported a .csv-file with all UK postcodes and one geopoint for all of them. With a filter and an append tool I could make the app user being able to select a postcode which is handed over to the formula tool generating the API-URL. In Alteryx it looks like this:
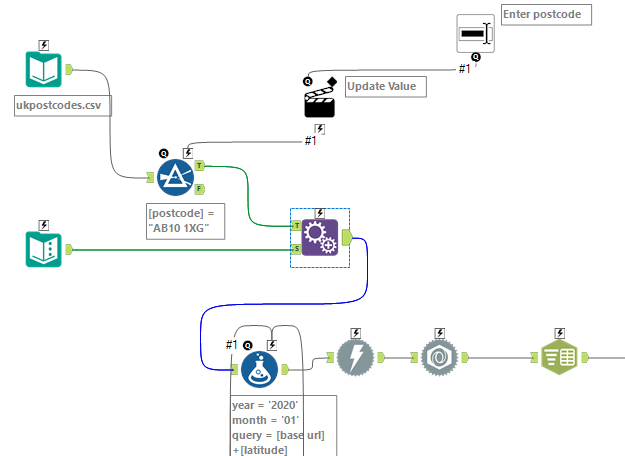
Note that this one geopoint will show you with the API all the crimes in a certain circle around this point. This circle does not take into account where the actual boundaries of the postcode are and therefore our crimes will be more in number than those that happened only in the selected postcode!
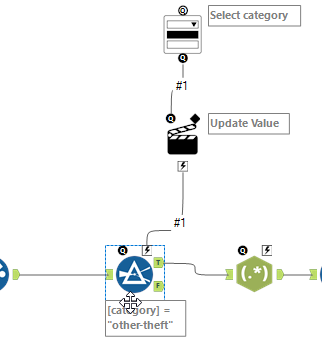
3. Task: category
The user selection of the category is similar to the postcode with a filter that becomes a new value from the action tool, but for the category, a text box tool would have created too many problems for the app user, so I used a dropdown tool where I had to manually enter all possible crime categories.
Very important is before saving to tick the mark 'Analytic App' by clicking on the canvas and the selecting 'Workflow' in the configuation window. Now we can save the App as .yxwz-File and it looks like this if we run it.